Contenido- Antecedentes
- Colección de estadísticas
- Visualización de estadísticas
- Visualización y estadísticas
- Escanear
- Conclusión
Antecedentes
Hola, los telegramas están ahora en la cima de la popularidad, todos los escándalos, intrigas y bloqueos giran a su alrededor, en relación con los cuales el telegrama lanzó su propia versión del proxy llamado Proxy MTProto, que está diseñado para ayudar a evitar el bloqueo. Sin embargo, los servicios de monitoreo proporcionados por el telegrama MTProto Proxy no permiten observar estadísticas en tiempo real y recopilarlas para monitorear sus cambios, por lo tanto, resolveremos el problema por nuestra cuenta.
Colección de estadísticas
La página oficial de Proxy MTProto en el
Docker Hub indica que podemos usar el
docker exec mtproto-proxy curl http://localhost:2398/stats para obtener estadísticas directamente del Proxy MTProto que está en el contenedor, por lo que nuestro código se verá así.
package main import ( "io/ioutil" "net/http" "strings" "time" ) type User struct { Num string } var Users User func CurrenUsers() (err error) {
total_special_connections indica en el mismo
Docker Hub que el número de conexiones de clientes entrantes
Visualización de estadísticas
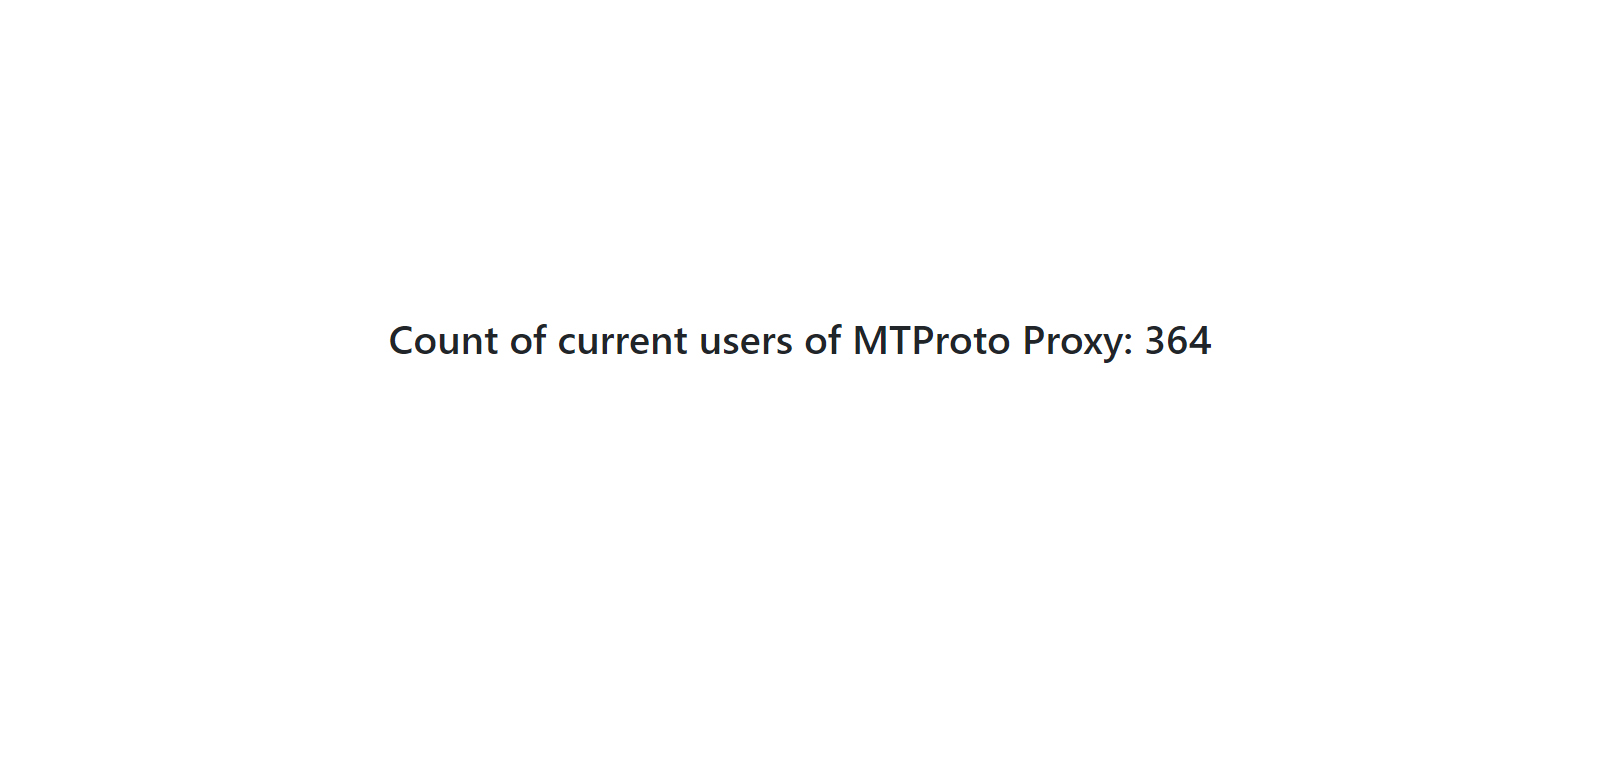
A continuación, debemos mostrar el número actual de usuarios de forma simple y conveniente, lo enviaremos al navegador.
package main import ( "html/template" "io/ioutil" "net/http" "strings" "time" ) type User struct { Num string } type HTML struct { IndexPage string } var Users User var IndexTemplate = HTML{ IndexPage: `<!DOCTYPE html> <html> <head> <link rel="stylesheet" href="https://stackpath.bootstrapcdn.com/bootstrap/4.1.0/css/bootstrap.min.css" integrity="sha384-9gVQ4dYFwwWSjIDZnLEWnxCjeSWFphJiwGPXr1jddIhOegiu1FwO5qRGvFXOdJZ4" crossorigin="anonymous"> <title>Stats</title> <meta name="viewport" content="width=device-width, initial-scale=1, shrink-to-fit=no"> </head> <body> <div class="container-fluid"> <div class="row justify-content-center text-center" style="margin-top: 20%"> <h1>Count of current users of MTProto Proxy: {{.Num}}</h1> </div> </div> </body> </html>`, } func CurrenUsers() (err error) {
que es initEn cualquier caso, se llamará a init antes de llamar a main
Ahora, yendo a la dirección IP de nuestro Proxy MTProto, podemos ver el número actual de clientes.
Visualización y estadísticas
Hay muchas opciones para visualizar y mantener estadísticas de
Datadog ,
Zabbix ,
Grafana ,
Graphite . Usaré Datadog. Usando el comando
go get -u github.com/DataDog/datadog-go/statsd importamos la biblioteca de
statsd y la usamos en el código.
package main import ( "html/template" "io/ioutil" "net/http" "os" "strconv" "strings" "time" "github.com/DataDog/datadog-go/statsd" ) var ( datadogIP = os.Getenv("DDGIP") tagName = os.Getenv("TGN") t, _ = strconv.Atoi(os.Getenv("TIMEOUT")) timeout = time.Duration(t) * time.Second ) type User struct { Num string } type HTML struct { IndexPage string } var Users User var IndexTemplate = HTML{ IndexPage: `<!DOCTYPE html> <html> <head> <link rel="stylesheet" href="https://stackpath.bootstrapcdn.com/bootstrap/4.1.0/css/bootstrap.min.css" integrity="sha384-9gVQ4dYFwwWSjIDZnLEWnxCjeSWFphJiwGPXr1jddIhOegiu1FwO5qRGvFXOdJZ4" crossorigin="anonymous"> <title>Stats</title> <meta name="viewport" content="width=device-width, initial-scale=1, shrink-to-fit=no"> </head> <body> <div class="container-fluid"> <div class="row justify-content-center text-center" style="margin-top: 20%"> <h1>Count of current users of MTProto Proxy: {{.Num}}</h1> </div> </div> </body> </html>`, } func (u User) convert() int64 { num, _ := strconv.Atoi(u.Num) return int64(num) } func CurrenUsers() (err error) {
Queda por recopilar todo en una imagen acoplable
FROM telegrammessenger/proxy COPY mtproto_proxy_stat . RUN echo "$(tail -n +2 run.sh)" > run.sh && echo '#!/bin/bash\n./mtproto_proxy_stat & disown' | cat - run.sh > temp && mv temp run.sh CMD [ "/bin/sh", "-c", "/bin/bash /run.sh"]
Escanear
Primero necesitamos comenzar el contenedor con el agente Datadog
docker run -d --name dd-agent -v /var/run/docker.sock:/var/run/docker.sock:ro -v /proc/:/host/proc/:ro -v /sys/fs/cgroup/:/host/sys/fs/cgroup:ro -e DD_DOGSTATSD_NON_LOCAL_TRAFFIC=true -e DD_API_KEY=_ datadog/agent:latest
IMPORTANTE para que podamos enviarle al agente nuestros datos, debe establecer
true para la variable de entorno
DD_DOGSTATSD_NON_LOCAL_TRAFFICLuego, usando el
docker inspect dd-agent necesitamos mirar la IP del contenedor para enviarle datos

e inicie nuestro Proxy MTProto conectándolo con un puente al contenedor del agente
docker run -d -p 443:443 -p 80:80 -e WORKERS=16 -e DDGIP=172.17.0.2 -e TGN=mtproto:main --link=dd-agent --name=mtproto --restart=always -v proxy-config:/data trigun117/mtproto_proxy_stat
Y en un par de minutos ya podemos construir un gráfico seleccionando la métrica y la fuente deseadas (la etiqueta que se especifica al iniciar el contenedor con MTProto Proxy)
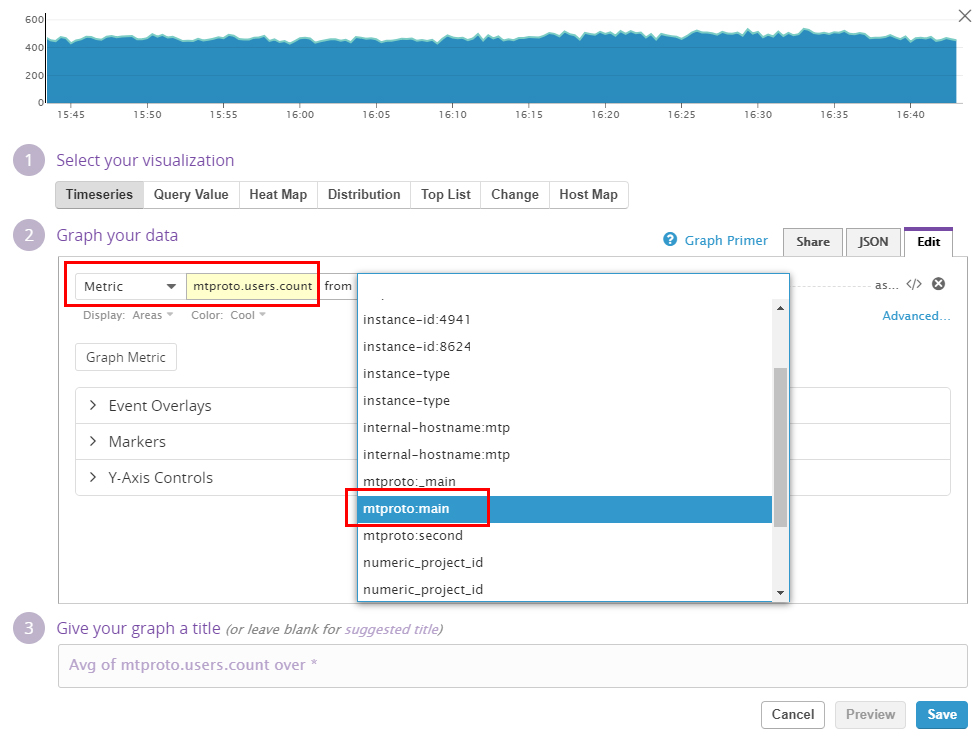
y mostrar nuestras estadísticas al respecto
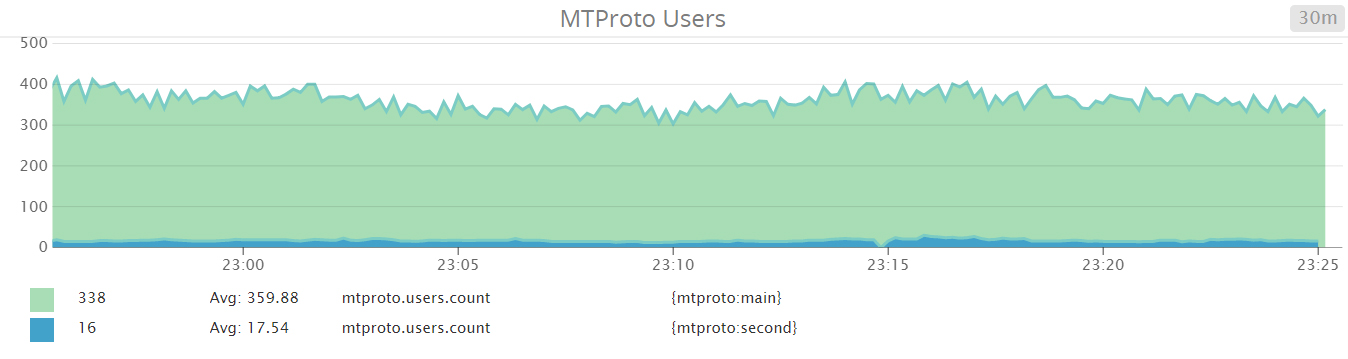 Ejemplo viviente
Conclusión
Descubrí nuevas herramientas para trabajar convenientemente con datos, conocí su gran variedad y elegí algo adecuado para mi gusto.
Gracias por su atención, sugiero que todos compartan sus opiniones, comentarios y sugerencias en los comentarios.
Repositorio de Github