Je suggère de lire une traduction gratuite d'un court article sur l'application pratique de GraphQL. L'original est disponible ici (
en ).
Quelques mots sur GraphQL
GraphQL est un langage de requête API qui offre une approche déclarative pour récupérer des données. Il permet aux clients de demander uniquement les données nécessaires à un serveur Web et rien de plus. Développé en 2012 par Facebook, qui est toujours pris en charge, GraphQL a commencé à être utilisé par de nombreuses autres grandes entreprises et non. Entre autres, Yelp, Shopify et Github.
Lorsque vous utilisez des API REST, les demandes sont généralement envoyées à plusieurs adresses pour obtenir toutes les données nécessaires dans l'application. L'API GraphQL vous permet d'envoyer la demande entière à l'adresse en indiquant exactement quelles données vous souhaitez recevoir avec cette demande. Par conséquent, soit dit en passant, GraphQL est idéal lorsqu'il est utilisé dans une connexion mobile lente.
Les versions d'API peuvent être un casse-tête pour les équipes de développement. Avec GraphQL, vous ne pouvez pas vous en soucier. GraphQL vous permet d'ajouter de nouveaux champs et types (cela sera discuté plus tard) dans votre API GraphQL sans affecter les requêtes existantes; les champs anciens et inutilisés peuvent être masqués des clients API. À l'aide d'une seule version évolutive, l'API GraphQL fournit à votre application un accès constant aux nouvelles implémentations d'API et fournit une base de code propre et facile à entretenir.
Prérequis
Avant de commencer, assurez-vous que Node version 6 et les versions antérieures sont installées. Vous pouvez vérifier la version avec la commande:
node -v
Si vous n'avez pas installé Node, accédez à l'URL:
https://nodejs.org/ et suivez les instructions d'installation.
Personnalisation de GraphQL et Express
Un moyen simple de créer un serveur d'API Graph est d'utiliser Express, un framework populaire pour Node.js. Installez Express à l'aide de npm:
npm init npm install express --save
Ensuite, installez `graphql` et` express-graphql`:
npm install graphql express-graphql --save
Ainsi, la structure initiale du dossier sera la suivante:
|---- node_modules
|---- package.json
Démarrage rapide dans l'API GraphQL
Dans cette petite section, nous allons essayer de créer rapidement une API GraphQL simple. Ceci est important pour une narration plus approfondie, afin qu'il vous apparaisse clairement ce que nous faisons exactement, à quoi ressemble l'API créée à l'aide de GraphQL. Si certains points vous paraissent difficiles et incompréhensibles, ne vous inquiétez pas, nous y reviendrons.
Alors maintenant, nous allons utiliser l'objet `buildSchema` de` graphql` pour créer le schéma (` schema '). Créez un fichier example.js dans notre dossier.
const express = require('express'); const { buildSchema } = require('graphql'); const graphqlHTTP = require('express-graphql'); let port = 3000; let schema = buildSchema(` type Query { postTitle: String, blogTitle: String } `); let root = { postTitle: () => { return 'Build a Simple GraphQL Server With Express and NodeJS'; }, blogTitle: () => { return 'scotch.io'; } }; const app = express(); app.use('/', graphqlHTTP({ schema: schema, rootValue: root, graphiql: true
Vous pouvez maintenant exécuter `example.js` dans le terminal:
node example.js
Maintenant sur localhost: 3000, vous pouvez découvrir GraphiQL. Il vous permettra de tester votre API dans un navigateur. Il prend en charge la saisie semi-automatique et fait des hypothèses pour vous en fonction des types et des champs disponibles dans votre schéma.

Maintenant, demandons notre schéma pour `blogTitle`:

Si simple que vous pouvez demander l'API GraphQL.
Présentation
Vous comprenez maintenant le fonctionnement de GraphQL et nous pouvons commencer le sujet plus en profondeur.
Commençons par créer un serveur GraphQL basé sur Express. Maintenant, dans notre dossier, créez le dossier `src` et créez et enregistrez le fichier` schema.js`. Ce fichier ressemblera à ceci:
Ensuite, créez le dossier `data` dans le dossier` src`. Nous y placerons 2 fichiers: 'auteurs.js' et 'posts.js'.
Le contenu de ces fichiers est assez volumineux, vous ne pouvez donc pas les prendre
via le lien sur Github ou sous le spoiler.
auteurs.js const Authors = [ { id: '8dlx7ak38fd39dv79ad', name: 'Orinami Olatunji', twitterHandle: '@orinami_' }, { id: 'jd3kd03d0w9a0l35rh74', name: 'Ojima Udale', twitterHandle: '@uncooloj' }, { id: '0hy894hf0dlkfh9oinv', name: 'Xabi Alonso', twitterHandle: '@alonso' } ]; module.exports = Authors;
posts.js const Posts = [ {'id':'0176413761b289e6d64c2c14a758c1c7','author_id':'0hy894hf0dlkfh9oinv','author':'alonso', 'category':'meteor','body':'Most developers and companies use two different apps for the marketing website and for the app itself. Thus, they can update each of the apps without affecting the other. [Stripe](https://stripe.com/), [Digital Ocean](https://www.digitalocean.com/) and many other companies follow this technique. Most Meteor apps also do the same.\n\nSo, in a scenario like this, sometimes we need to show the login state of the app on the landing page too. For an example, see our Kadira home page (\u003chttps://kadira.io\u003e). If you are logged into the Kadira app (\u003chttps://ui.kadira.io\u003e), we show a button with "Open Kadira UI" on the home page, which replaces the login button.\n\n[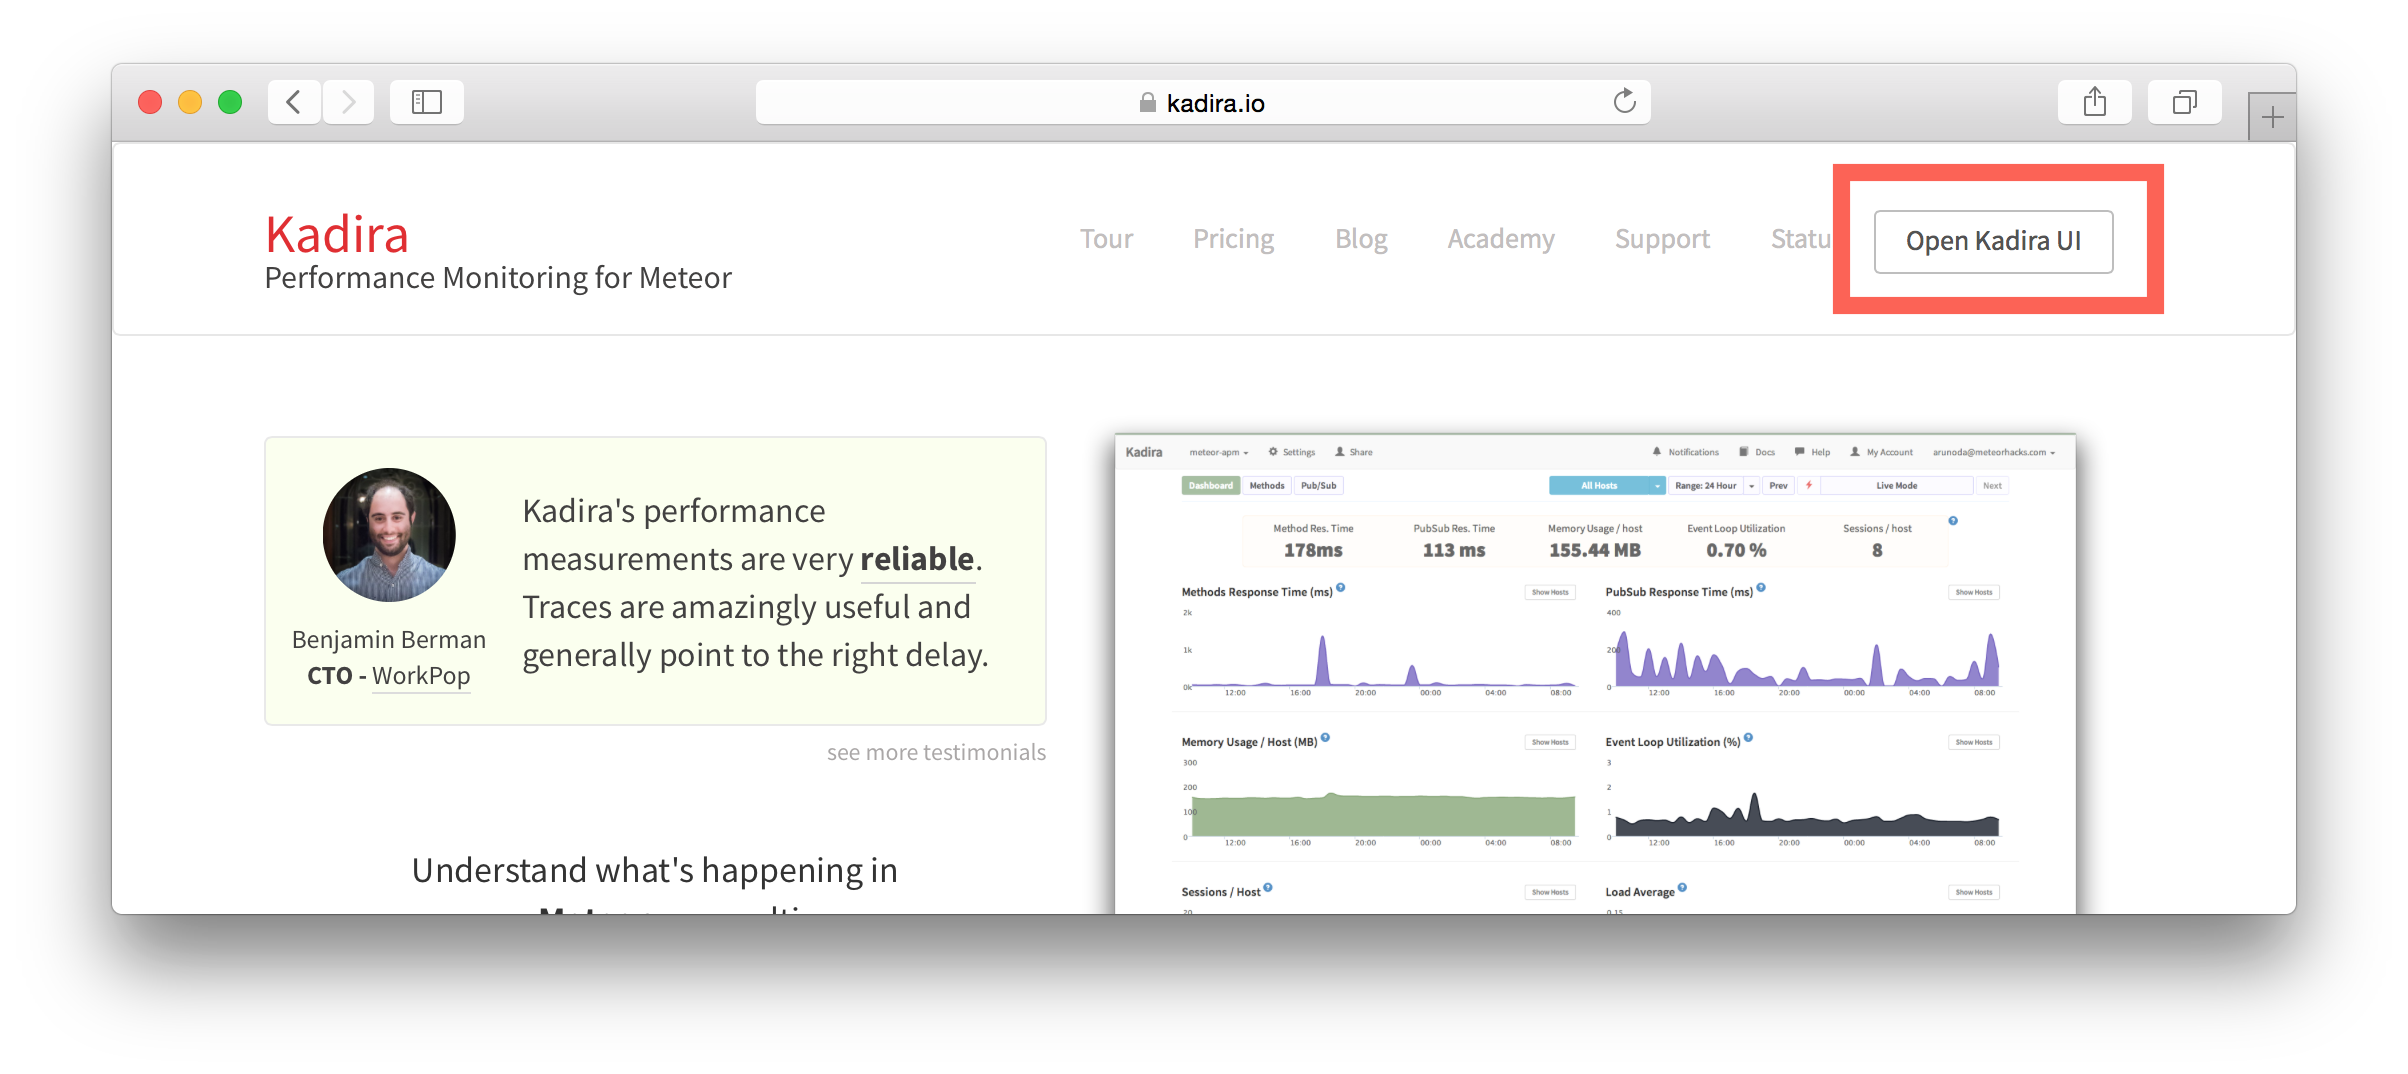](https://kadira.io)\n\n## How Did We Do It?\n\nMeteor does not have a built-in way to share login states across multiple apps or subdomains. So, we have to find an alternative way to do so.\n\nAs a solution, we can use browser cookies to share the login state between multiple domains. That\'s exactly what we did. We wrapped this up into a Meteor package, which now you can also use.\n\nIn this guide, I\'m going to explain how to share the login state between multiple domains using the [`kadira:login-state`](https://github.com/kadirahq/meteor-login-state) package.\n\n### On Meteor App\n\nFirst of all, install the `kadira:login-state` package in your Meteor app:\n\n~~~\nmeteor add kadira:login-state\n~~~\n\nThen, you need to add a new entry in the `public` object as the `loginState` in the `settings.json` file for your app. (If you haven\'t created the settings.json yet, you need to create it first.)\n\n~~~json\n{\n "public": {\n "loginState": {\n "domain": ".your-domain-name.com",\n "cookieName": "app-login-state-cookie-name"\n }\n }\n}\n~~~\n\nThe `domain` field must be your main domain name, starting with a dot. It allows you to share the login state, which can be accessed from any of its subdomains. You can use any appropriate identifier, such as `cookieName`.\n\nNow, everything has been set up on the Meteor app.\n\n### On the Static App (the Landing Page)\n\nNow we have to show the login state of the app on the landing page. For this, we need to add support for the login state for the static app (or landing page).\n\nActually, there are three different ways to do this. Here I will show you how to do so by pasting a few lines of JavaScript code.\n\nYou need to create a JavaScript file in your js folder. I create it as `js/login_state.js`. After that, copy and paste the following code snippet into it:\n\n~~~javascript\nLoginState = {};\n\nLoginState.get = function(cookieName) {\n var loginState = getCookie(cookieName);\n if(loginState) {\n return JSON.parse(decodeURIComponent(loginState));\n } else {\n return false;\n }\n};\n\nfunction getCookie(cname) {\n var name = cname + "=";\n var ca = document.cookie.split(\';\');\n for(var i=0; i \u003c ca.length; i++) {\n var c = ca[i];\n while (c.charAt(0)==\' \') c = c.substring(1);\n if (c.indexOf(name) != -1) return c.substring(name.length,c.length);\n }\n return;\n}\n~~~\n\nInsert that file into the head section of your HTML document: \n\n`\u003cscript src="js/login-state.js"\u003e\u003c/script\u003e`\n\n\u003e If you prefer, you can also use [Browserify](https://github.com/kadirahq/meteor-login-state#installing-via-browserify) or [Bower](https://github.com/kadirahq/meteor-login-state#installing-via-bower) to load the above JS file.\n\u003e The package name for both Browserify and Bower is `meteor-login-state`.\n\nThen, use the following code to get the login state of your app. You need to provide the relevant `cookieName` to do so: \n\n~~~javascript\nvar loginState = LoginState.get("app-login-state-cookie-name");\nif(loginState) {\n // the user has loggedIn to the meteor app\n // see the loginState Object for the addtional data\n // (append your code here!)\n console.log(loginState);\n} else {\n // user has not loggedIn yet.\n // (append your code here!) \n}\n~~~\n\nThe `loginState` object will be something like this:\n\n~~~json\n{\n timestamp: 1435835751489,\n username: "username",\n userId: "meteor-user-id",\n email: "user@email.com"\n url: "https://ui.kadira.io"\n}\n~~~\n\nNow you can do whatever you need to do with the login state.\n\nGive it a try and let me know what you think.','date':{'$date':'2015-07-07T00:00:00.000Z'},'layout':'blog_post','slug':'sharing-meteor-login-state-between-sub-domains','summary':'In this blog we\'ll show you how we shared login state between our static web app and our Meteor app Kadira UI.','title':'Sharing the Meteor Login State Between Subdomains'}, {'id':'03390abb5570ce03ae524397d215713b','author_id':'0hy894hf0dlkfh9oinv','author':'alonso', 'category':'product','body':'Here is a common feedback we received from our users:\n\n\u003e Hi, I have a suggestion. It would be great if I could "dismiss" errors or mark them as resolved on my end. This way, I can keep track of which errors I have resolved.\n\nToday we are happy to announce new Kadira feature which allows you to track **status** to errors. With that, you can mark errors as "Ignored", "Fixing" or "Fixed".\n\nOnce you mark an error as "Ignored", it will be hidden. \n\nBut you can click on "Show Ignored Errors" checkbox or filter by "ignored" status to view them again.\n\n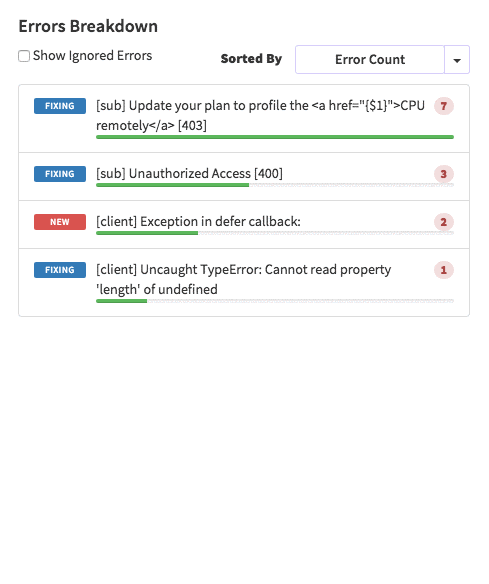\n\nYou can also filter errors by status like this:\n\n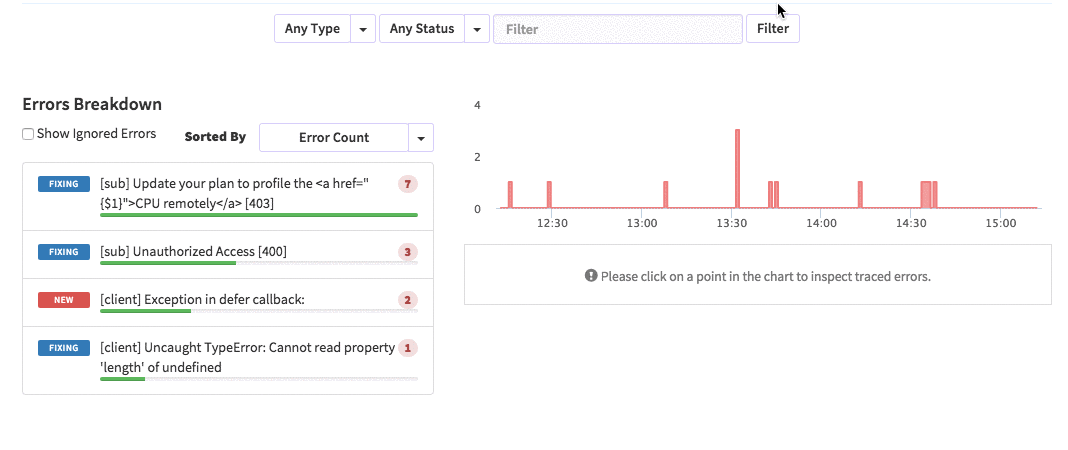\n\nWe are rolling out this feature to all our paid users. [Give it a try](https://ui.kadira.io/apps/AUTO/errors/overview?metric=count).\n\n### What's next?\n\nRight now we are planning to add few more feature related this. Could you help us on [prioritizing](https:
Types dans GraphQL
GraphQL a le module 'grapql / type' utilisé pour déterminer le type. Les types peuvent être importés à partir du module 'graphql / type' ou du module racine 'graphql'.Les types de base incluent ID , String , Int , Float et Boolean . Nous ajoutons également le type d'auteur. Pour ce faire, ajoutez à notre fichier schema.js: const AuthorType = new GraphQLObjectType({ name: "Author", description: "This represent an author", fields: () => ({ id: {type: new GraphQLNonNull(GraphQLString)}, name: {type: new GraphQLNonNull(GraphQLString)}, twitterHandle: {type: GraphQLString} }) });
Comme vous pouvez le voir, pour ajouter un nouveau type, nous avions besoin: créer un objet de la classe GraphQLObjectType et prescrire certaines de ses propriétés. Nom et description - pour décrire le type, Champs pour définir les attributs du type Auteur: id, nom et twitterHandler.Plus de détails sur les types sur graphql.org/graphql-js/type/Maintenant, créons un type pour les publications: const PostType = new GraphQLObjectType({ name: "Post", description: "This represent a Post", fields: () => ({ id: {type: new GraphQLNonNull(GraphQLString)}, title: {type: new GraphQLNonNull(GraphQLString)}, body: {type: GraphQLString}, author: { type: AuthorType, resolve: function(post) { return _.find(Authors, a => a.id == post.author_id); } } }) });
Ajoutez ceci à schema.js. Cela créera un objet PostType qui sera utilisé dans la requête racine (littéralement la requête racine. En fait, le point d'entrée de notre API GraphQL).Racine racine
La requête racine est utilisée pour révéler les ressources disponibles pour les clients de votre application. Nous pourrions mettre à disposition 2 ressources: les auteurs et les articles.Ajoutons à notre fichier `schema.js`: const BlogQueryRootType = new GraphQLObjectType({ name: 'BlogAppSchema', description: "Blog Application Schema Query Root", fields: () => ({ authors: { type: new GraphQLList(AuthorType), description: "List of all Authors", resolve: function() { return Authors } }, posts: { type: new GraphQLList(PostType), description: "List of all Posts", resolve: function() { return Posts } } }) });
Ici, la requête racine est définie comme BlogQueryRootType. Si vous remarquez, un nouveau type a été déclaré ici: new GraphQLList (). Il crée un wrapper autour d'autres types qui représente une liste de ces types.Définition du schéma
Le diagramme définit comment vous souhaitez que les données de votre application soient générées et comment vous souhaitez que les données soient connectées les unes aux autres. La définition du schéma affecte la façon dont les données seront stockées dans votre base de données (ou bases de données). Dans la définition de schéma, vous déterminez également quelles requêtes, mutations et abonnements seront disponibles pour votre interface d'affichage de données.Ajoutons un schéma à notre fichier: const BlogAppSchema = new GraphQLSchema({ query: BlogQueryRootType });
Ici, la requête se voit attribuer l'objet BlogQueryRootType, qui sera utilisé comme demande d'API racine.Implémentation de l'API GraphQL
Nous avons besoin du paquet `lodash`. `Lodash` est une boîte à outils Javascript qui fournit des méthodes propres et performantes pour manipuler des objets et des collections. Si vous connaissiez la bibliothèque de soulignements, c'est génial! Lodash a été créé à partir de celui-ci en ajoutant des fonctionnalités supplémentaires et en résolvant certains problèmes de performances de soulignement. npm install lodash --save
Avec cette commande, la bibliothèque lodash sera installée et la dépendance correspondante ajoutée au fichier package.json.Ajoutez le code suivant en haut du fichier schema.js. const _ = require('lodash');
Examinons maintenant le fichier schema.js. C'est à quoi le fichier devrait ressembler à la fin. const _ = require('lodash');
Si vous remarquez dans PostType, nous avons un attribut de résolution supplémentaire. Resolve est une fonction qui peut manipuler des données, convertir leurs valeurs, etc. et les remettre à la fin de l'opération.BlogAppSchema sera exporté dans le fichier server.js à l'aide de module.exportsMaintenant, créez le fichier server.js dans le dossier racine et ajoutez ce code: const express = require('express'); const graphqlHTTP = require('express-graphql'); const schema = require('./src/schema.js'); let port = 3000; const app = express(); app.use('/', graphqlHTTP({ schema: schema, graphiql: true })); app.listen(port); console.log('GraphQL API server running at localhost:'+ port);
Maintenant, vérifiez notre résultat sur localhost: 3000. Pour ce faire, ouvrez un terminal et procédez comme suit: node server.js
Résultat:
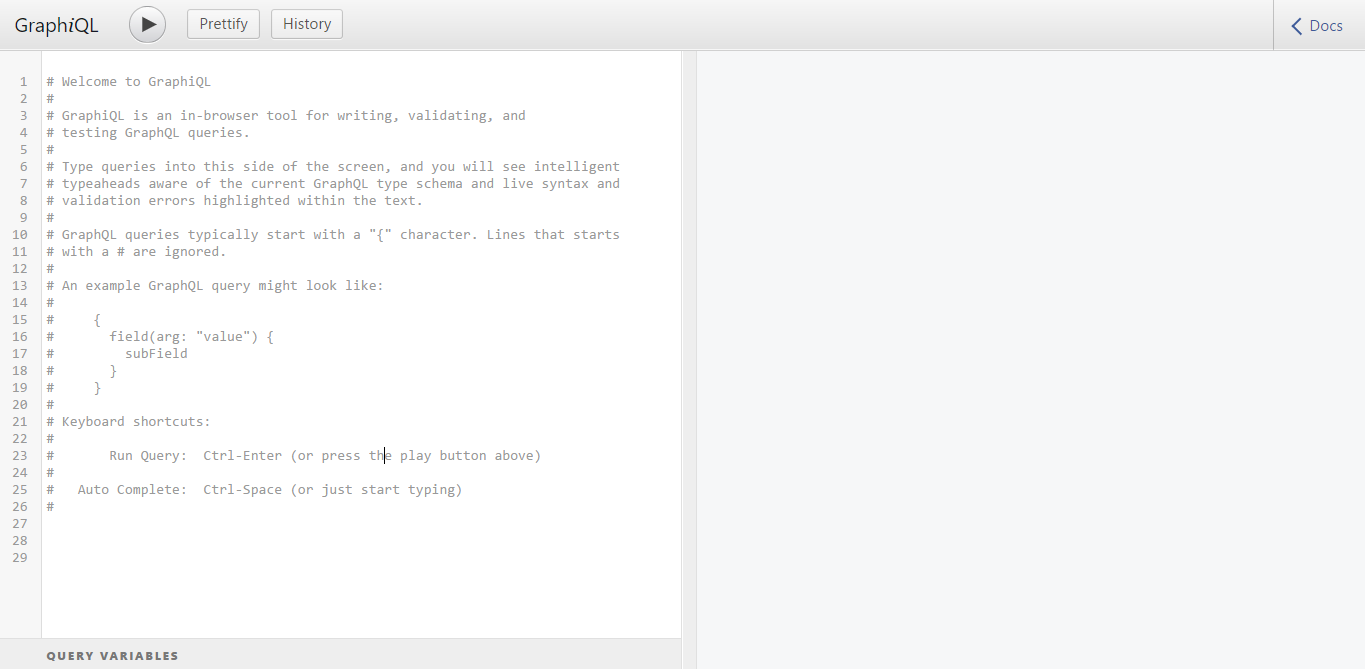 C'est graphiql, il vous aidera à tester l'API dans le navigateur. Donc, la requête suivante:
 { posts { id title author { name } } }
Donnera un résultat comme celui-ci: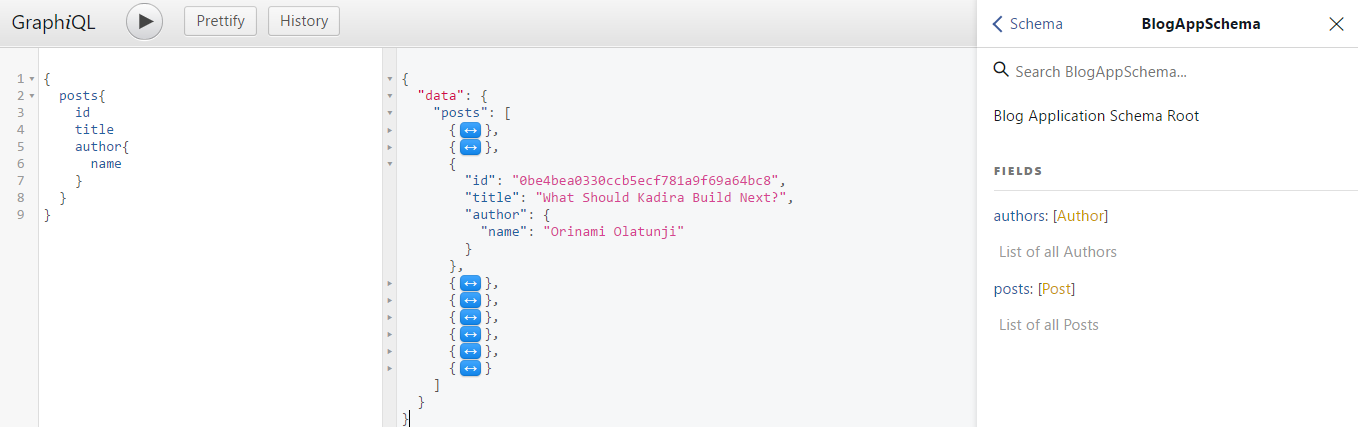
Conclusion
Je suis tellement content d'avoir terminé cette leçon avec vous. Vous savez maintenant comment créer une API GraphQL basée sur Express et NodeJS. J'espère que la leçon a été intéressante et que vous en avez beaucoup appris.Si vous voulez en savoir plus sur GraphQL, visitez graphql.org .