Conteúdo- Antecedentes
- Coleta de estatísticas
- Exibição de estatísticas
- Visualização e estatística
- Digitalizar
- Conclusão
Antecedentes
Olá pessoal, os telegramas estão agora no auge da popularidade, todos os escândalos, intrigas e bloqueios giram em torno dele, em conexão com o qual o telegrama lançou sua própria versão do proxy chamada MTProto Proxy, projetada para ajudar a contornar a fechadura. No entanto, os serviços de monitoramento fornecidos pelo telegrama MTProto Proxy não permitem observar estatísticas em tempo real e coletá-las para monitorar suas alterações, portanto, resolveremos o problema por conta própria.
Coleta de estatísticas
A página oficial do MTProto Proxy no
Docker Hub afirma que podemos usar o
docker exec mtproto-proxy curl http://localhost:2398/stats para obter estatísticas diretamente do MTProto Proxy que está no contêiner, portanto, nosso código ficará assim.
package main import ( "io/ioutil" "net/http" "strings" "time" ) type User struct { Num string } var Users User func CurrenUsers() (err error) {
total_special_connections indicado no mesmo
Docker Hub que o número de conexões de entrada do cliente
Exibição de estatísticas
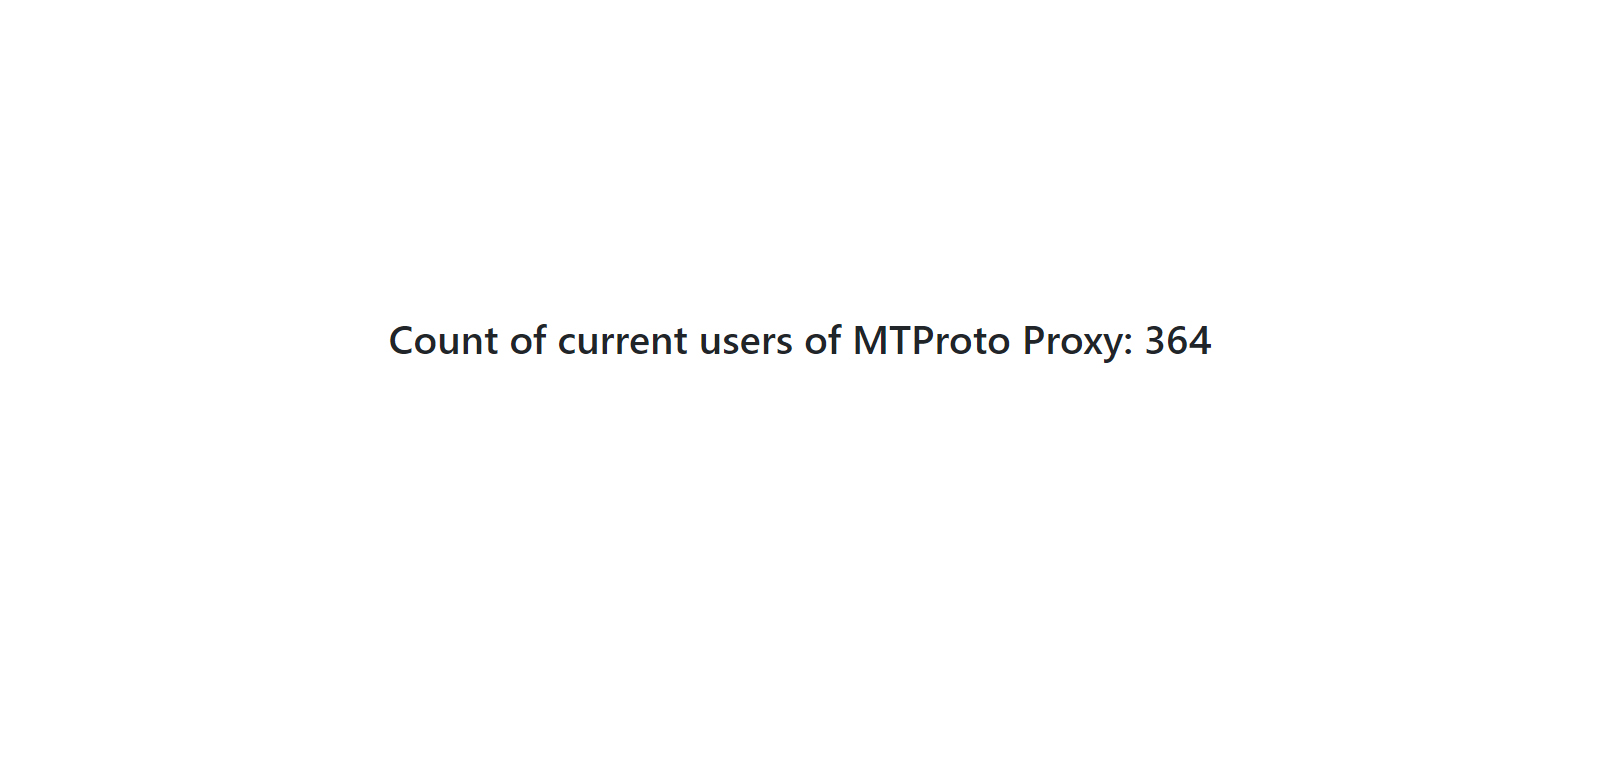
Em seguida, precisamos exibir o número atual de usuários de uma forma simples e conveniente, e o enviaremos para o navegador.
package main import ( "html/template" "io/ioutil" "net/http" "strings" "time" ) type User struct { Num string } type HTML struct { IndexPage string } var Users User var IndexTemplate = HTML{ IndexPage: `<!DOCTYPE html> <html> <head> <link rel="stylesheet" href="https://stackpath.bootstrapcdn.com/bootstrap/4.1.0/css/bootstrap.min.css" integrity="sha384-9gVQ4dYFwwWSjIDZnLEWnxCjeSWFphJiwGPXr1jddIhOegiu1FwO5qRGvFXOdJZ4" crossorigin="anonymous"> <title>Stats</title> <meta name="viewport" content="width=device-width, initial-scale=1, shrink-to-fit=no"> </head> <body> <div class="container-fluid"> <div class="row justify-content-center text-center" style="margin-top: 20%"> <h1>Count of current users of MTProto Proxy: {{.Num}}</h1> </div> </div> </body> </html>`, } func CurrenUsers() (err error) {
o que é initem qualquer caso, o init será chamado antes de chamar o main
Agora, indo para o endereço IP do nosso MTProto Proxy, podemos ver o número atual de clientes.
Visualização e estatística
Existem muitas opções para visualizar e manter estatísticas de
Datadog ,
Zabbix ,
Grafana ,
Graphite . Vou usar o Datadog. Usando o comando
go get -u github.com/DataDog/datadog-go/statsd importamos a biblioteca
statsd e a usamos no código.
package main import ( "html/template" "io/ioutil" "net/http" "os" "strconv" "strings" "time" "github.com/DataDog/datadog-go/statsd" ) var ( datadogIP = os.Getenv("DDGIP") tagName = os.Getenv("TGN") t, _ = strconv.Atoi(os.Getenv("TIMEOUT")) timeout = time.Duration(t) * time.Second ) type User struct { Num string } type HTML struct { IndexPage string } var Users User var IndexTemplate = HTML{ IndexPage: `<!DOCTYPE html> <html> <head> <link rel="stylesheet" href="https://stackpath.bootstrapcdn.com/bootstrap/4.1.0/css/bootstrap.min.css" integrity="sha384-9gVQ4dYFwwWSjIDZnLEWnxCjeSWFphJiwGPXr1jddIhOegiu1FwO5qRGvFXOdJZ4" crossorigin="anonymous"> <title>Stats</title> <meta name="viewport" content="width=device-width, initial-scale=1, shrink-to-fit=no"> </head> <body> <div class="container-fluid"> <div class="row justify-content-center text-center" style="margin-top: 20%"> <h1>Count of current users of MTProto Proxy: {{.Num}}</h1> </div> </div> </body> </html>`, } func (u User) convert() int64 { num, _ := strconv.Atoi(u.Num) return int64(num) } func CurrenUsers() (err error) {
Resta coletar tudo em uma imagem do docker
FROM telegrammessenger/proxy COPY mtproto_proxy_stat . RUN echo "$(tail -n +2 run.sh)" > run.sh && echo '#!/bin/bash\n./mtproto_proxy_stat & disown' | cat - run.sh > temp && mv temp run.sh CMD [ "/bin/sh", "-c", "/bin/bash /run.sh"]
Digitalizar
Primeiro, precisamos iniciar o contêiner com o agente Datadog
docker run -d --name dd-agent -v /var/run/docker.sock:/var/run/docker.sock:ro -v /proc/:/host/proc/:ro -v /sys/fs/cgroup/:/host/sys/fs/cgroup:ro -e DD_DOGSTATSD_NON_LOCAL_TRAFFIC=true -e DD_API_KEY=_ datadog/agent:latest
IMPORTANTE, para que possamos enviar nossos dados ao agente, é necessário definir
true para a variável de ambiente
DD_DOGSTATSD_NON_LOCAL_TRAFFICEm seguida, usando o
docker inspect dd-agent precisamos examinar o IP do contêiner para enviar dados a ele

e inicie nosso MTProto Proxy conectando-o a uma ponte no contêiner do agente
docker run -d -p 443:443 -p 80:80 -e WORKERS=16 -e DDGIP=172.17.0.2 -e TGN=mtproto:main --link=dd-agent --name=mtproto --restart=always -v proxy-config:/data trigun117/mtproto_proxy_stat
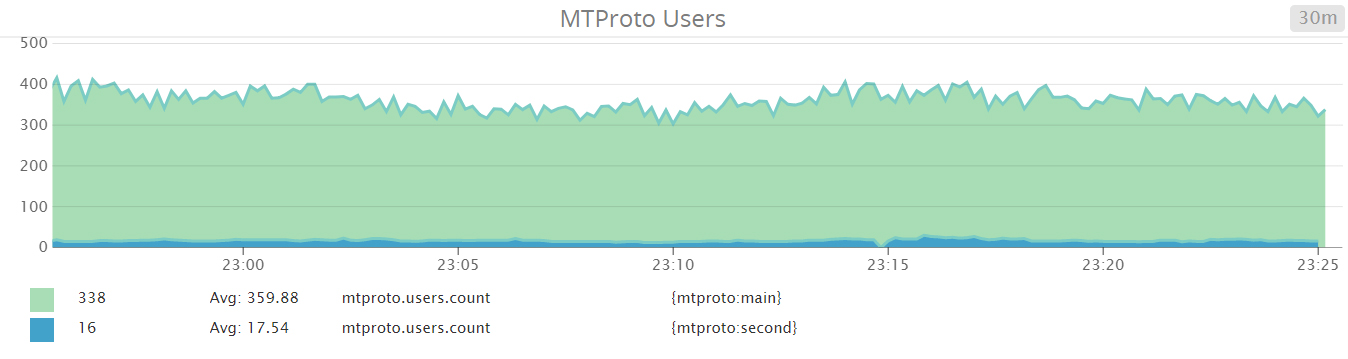
E em alguns minutos já podemos criar um gráfico selecionando a métrica e a fonte desejadas (a tag especificada ao iniciar o contêiner com o ProProte MTProto)
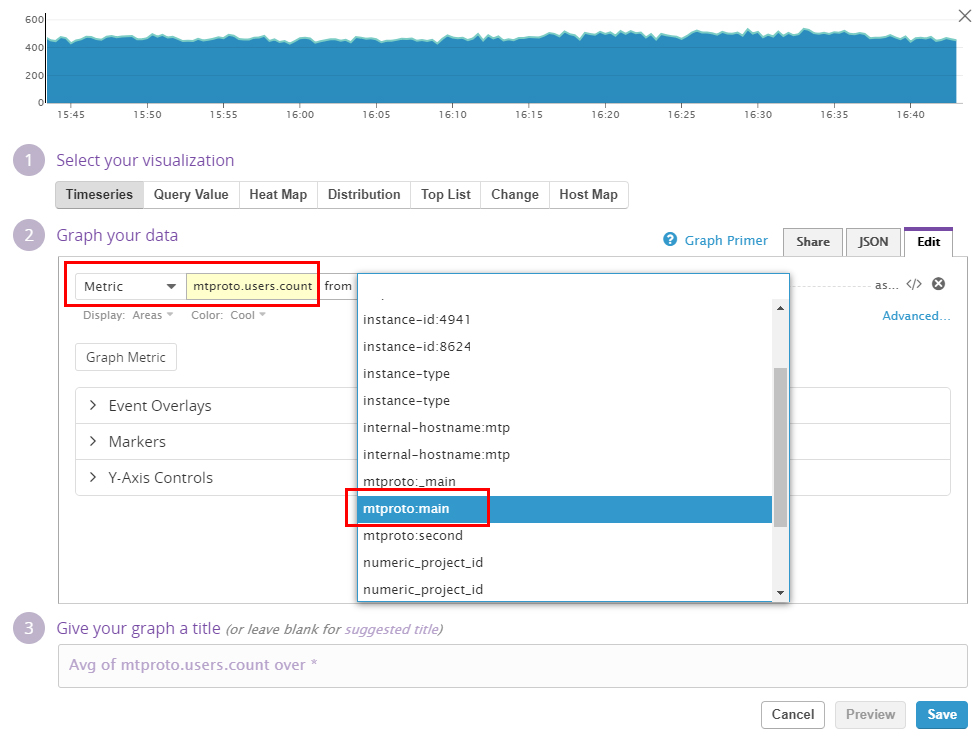
e exibir nossas estatísticas
 Exemplo vivo
Conclusão
Descobri novas ferramentas para um trabalho conveniente com dados, familiarizei-me com a grande variedade e escolhi algo adequado ao meu gosto.
Obrigado pela atenção, sugiro que todos compartilhem suas opiniões, comentários e sugestões nos comentários.
Repositório do Github