 Postagem original + Funções de suporte e dados de origem
Sumário
Relacionamentos de Personagem-
Quem deu à luz quem?-
Quem a quem irmão ou irmã-
Quem matou quem?-
Quem serve a quem?-
Quem é casado com alguém ou está noivo-
Quem fez sexo com quem?-
Todos os relacionamentos em uma colunaVinculando caracteres por cenaQuem é o personagem mais "popular" de Game of Thrones?- A
quantidade de tempo de tela para os personagens-
Quantos personagens havia na série?-
Qual dos personagens estava no maior número de episódios de Game of Thrones?Os locais mais populares "Game of Thrones"-
Mapa de locais "Game of Thrones"-
Personagens em movimento de Game of Thrones de série em série-
Quem “viajou” mais dos personagens de “Game of Thrones”?-
Os locais mais populares "Game of Thrones" (na tela)Quais filmes os atores de Game of Thrones jogaram e quão familiarizados eles são?-
Filmes em que os atores mais populares de Game of Thrones atuaram:-
Atores do Game of Thrones em Harry Potter-
Atores do Game of Thrones em Guerra nas Estrelas-
Atores de Game of Thrones em Piratas do Caribe-
Em quais filmes / séries existem muitos atores de "Game of Thrones"-
Qual a proximidade entre os atores de Game of Thrones?Conversas em Game of ThronesPersonagens de Gender of Game of Thrones: quem é mais, homem ou mulher?
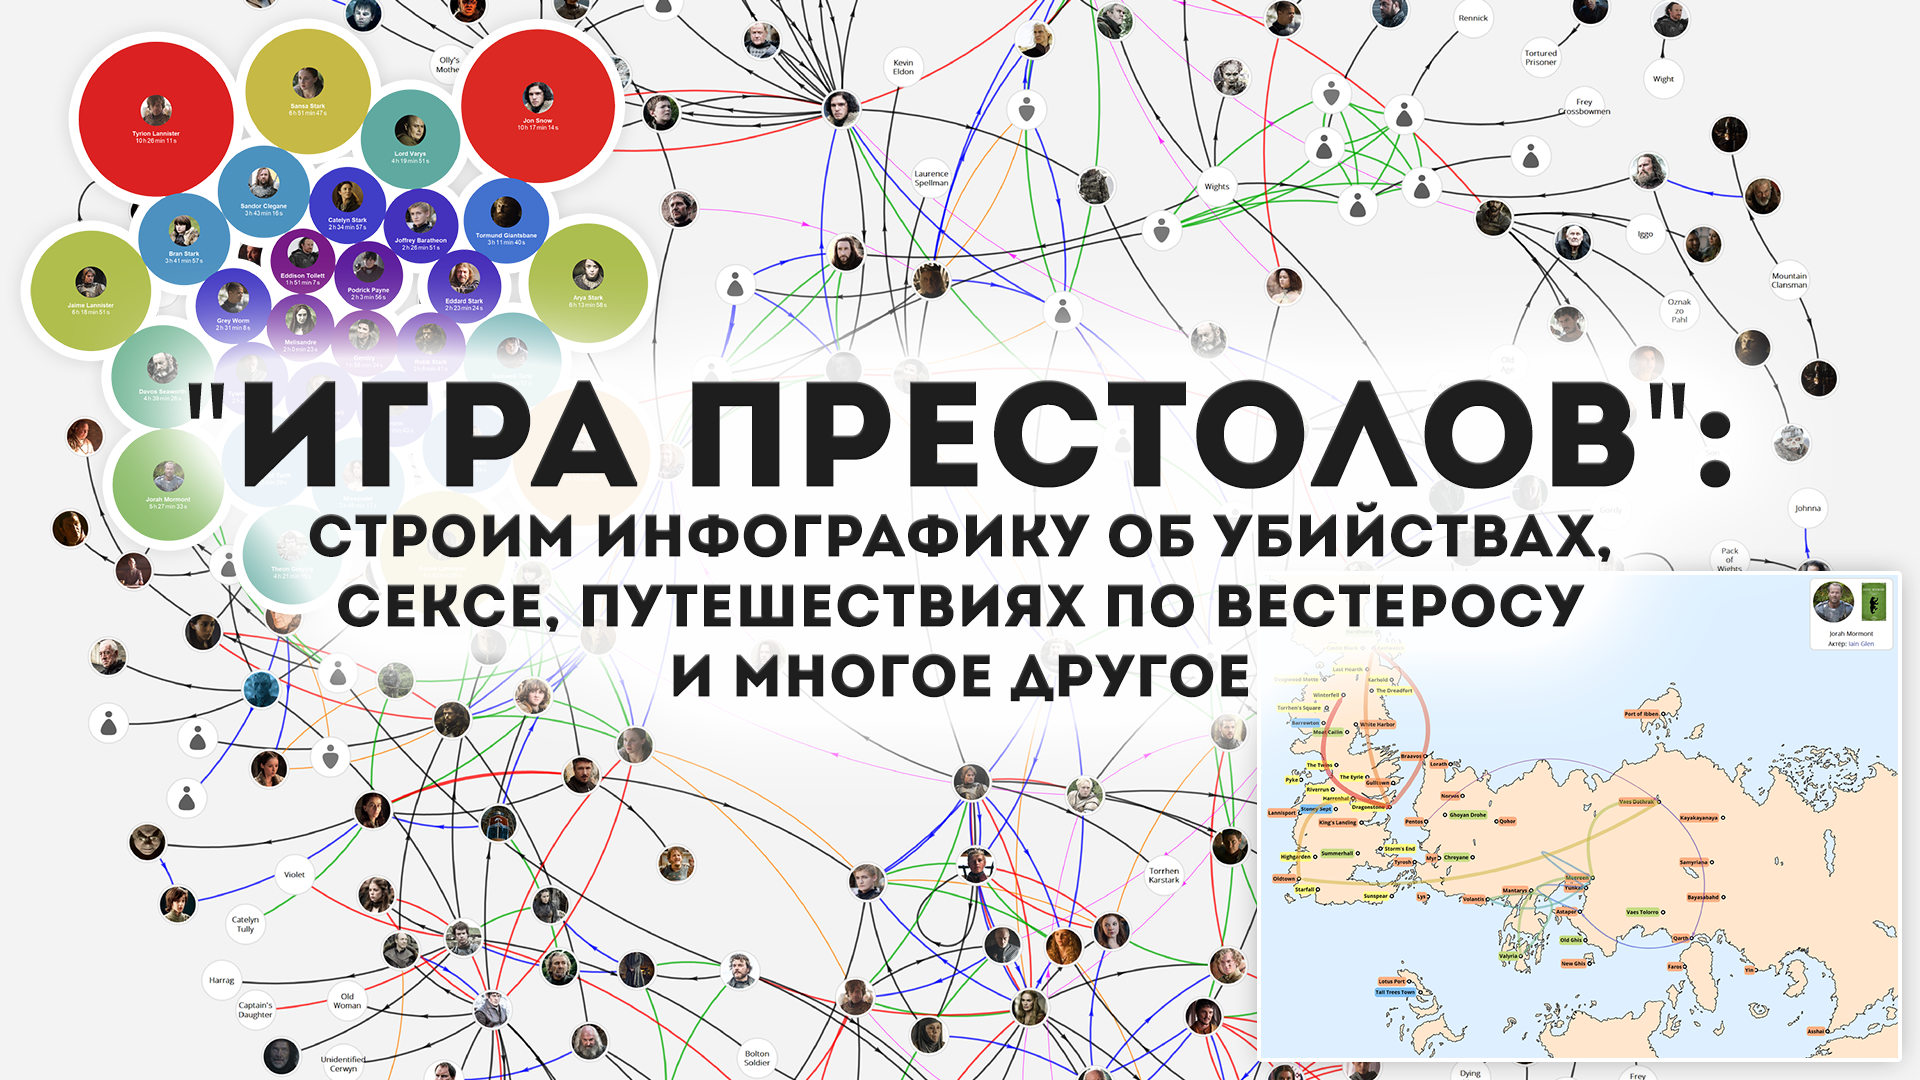
Neste post, falarei sobre como usar a linguagem Wolfram Languge na análise e visualização de dados usando o banco de dados de Game of Thrones como exemplo. Este artigo não presta muita atenção à análise de dados; falarei sobre isso separadamente. Em vez disso, o post é inteiramente dedicado a infográficos interessantes e sua criação.
Espero que as visualizações construídas interessem a quem gosta desta série maravilhosa).
O infográfico criado para a postagem é interativo no documento do Mathematica, que pode ser baixado do link no cabeçalho.
Relacionamentos de Personagem
Um conjunto de arestas em um gráfico de relacionamentos de caracteres por tipo:
$GOTCharacterLinks= Module[{parser}, parser= Flatten[ Thread/@ DeleteCases[ Lookup[ GOTRawData["characters.json"][ "characters" ], {"characterName",#} ], {_,_Missing} ], 1 ]&; <| "" -> Union[ DirectedEdge[#[[2]],#[[1]]]&/@parser["parents"], DirectedEdge[#[[1]],#[[2]]]&/@parser["parentOf"] ], "" -> DeleteDuplicates[ UndirectedEdge[#[[2]],#[[1]]]&/@parser["siblings"], #1===Reverse[#2]& ], ""-> Union[ DirectedEdge[#[[2]],#[[1]]]&/@parser["killedBy"], DirectedEdge[#[[1]],#[[2]]]&/@parser["killed"] ], ""->(DirectedEdge[#[[1]],#[[2]]]&/@parser["serves"]), "" -> DeleteDuplicates[ UndirectedEdge[#[[1]],#[[2]]]&/@parser["marriedEngaged"], #1===Reverse[#2]& ], ""-> DeleteDuplicates[ Flatten[ Map[ Thread@UndirectedEdge[#[[1]],#[[2]]["with"]]&, Lookup[#,{"name","sex"}]&/@ Select[ Select[ Flatten[ Lookup[ Flatten[ GOTRawData[ "episodes.json" ][ "episodes" ][ [;;,"scenes"] ], 1 ], "characters" ] ], Keys[#]=!={"name"}& ], MemberQ[Keys[#],"sex"]& ] ] ], #1===Reverse[#2]& ]|> ];
Função
GOTCharacterLinksGraph para representar graficamente os relacionamentos dos personagens de Game of Thrones.
ClearAll[GOTCharacterLinksGraph]; GOTCharacterLinksGraph[ data_, OptionsPattern[ { "ImageSize"->1500, "VertexSize"->Automatic, "GraphLayout"->"GravityEmbedding" } ] ]:= Module[{vertexList}, vertexList= DeleteDuplicates[Flatten[data[[;;,1]]/._[x_,y_]:>{x,y}]]; Graph[ data, VertexLabels-> Map[ Rule[ #, Placed[ Tooltip[ If[ Head[#]===Image, Image[#,ImageSize->60], (* else *) Style[ StringReplace[#," "->"\n"], LineSpacing->{0.8,0,0}, FontFamily->"Open Sans Light", Bold, 12 ] ]&[ #/.$characterImage ], #/.$characterCardFull ], {1/2,1/2} ] ]&, vertexList ], VertexShapeFunction->"Circle", VertexSize->OptionValue["VertexSize"], VertexStyle-> Directive[ {White,EdgeForm[{LightGray,AbsoluteThickness[2]}]} ], ImageSize->OptionValue["ImageSize"], Background->GrayLevel[0.95], AspectRatio->1, GraphLayout->OptionValue["GraphLayout"] ] ];
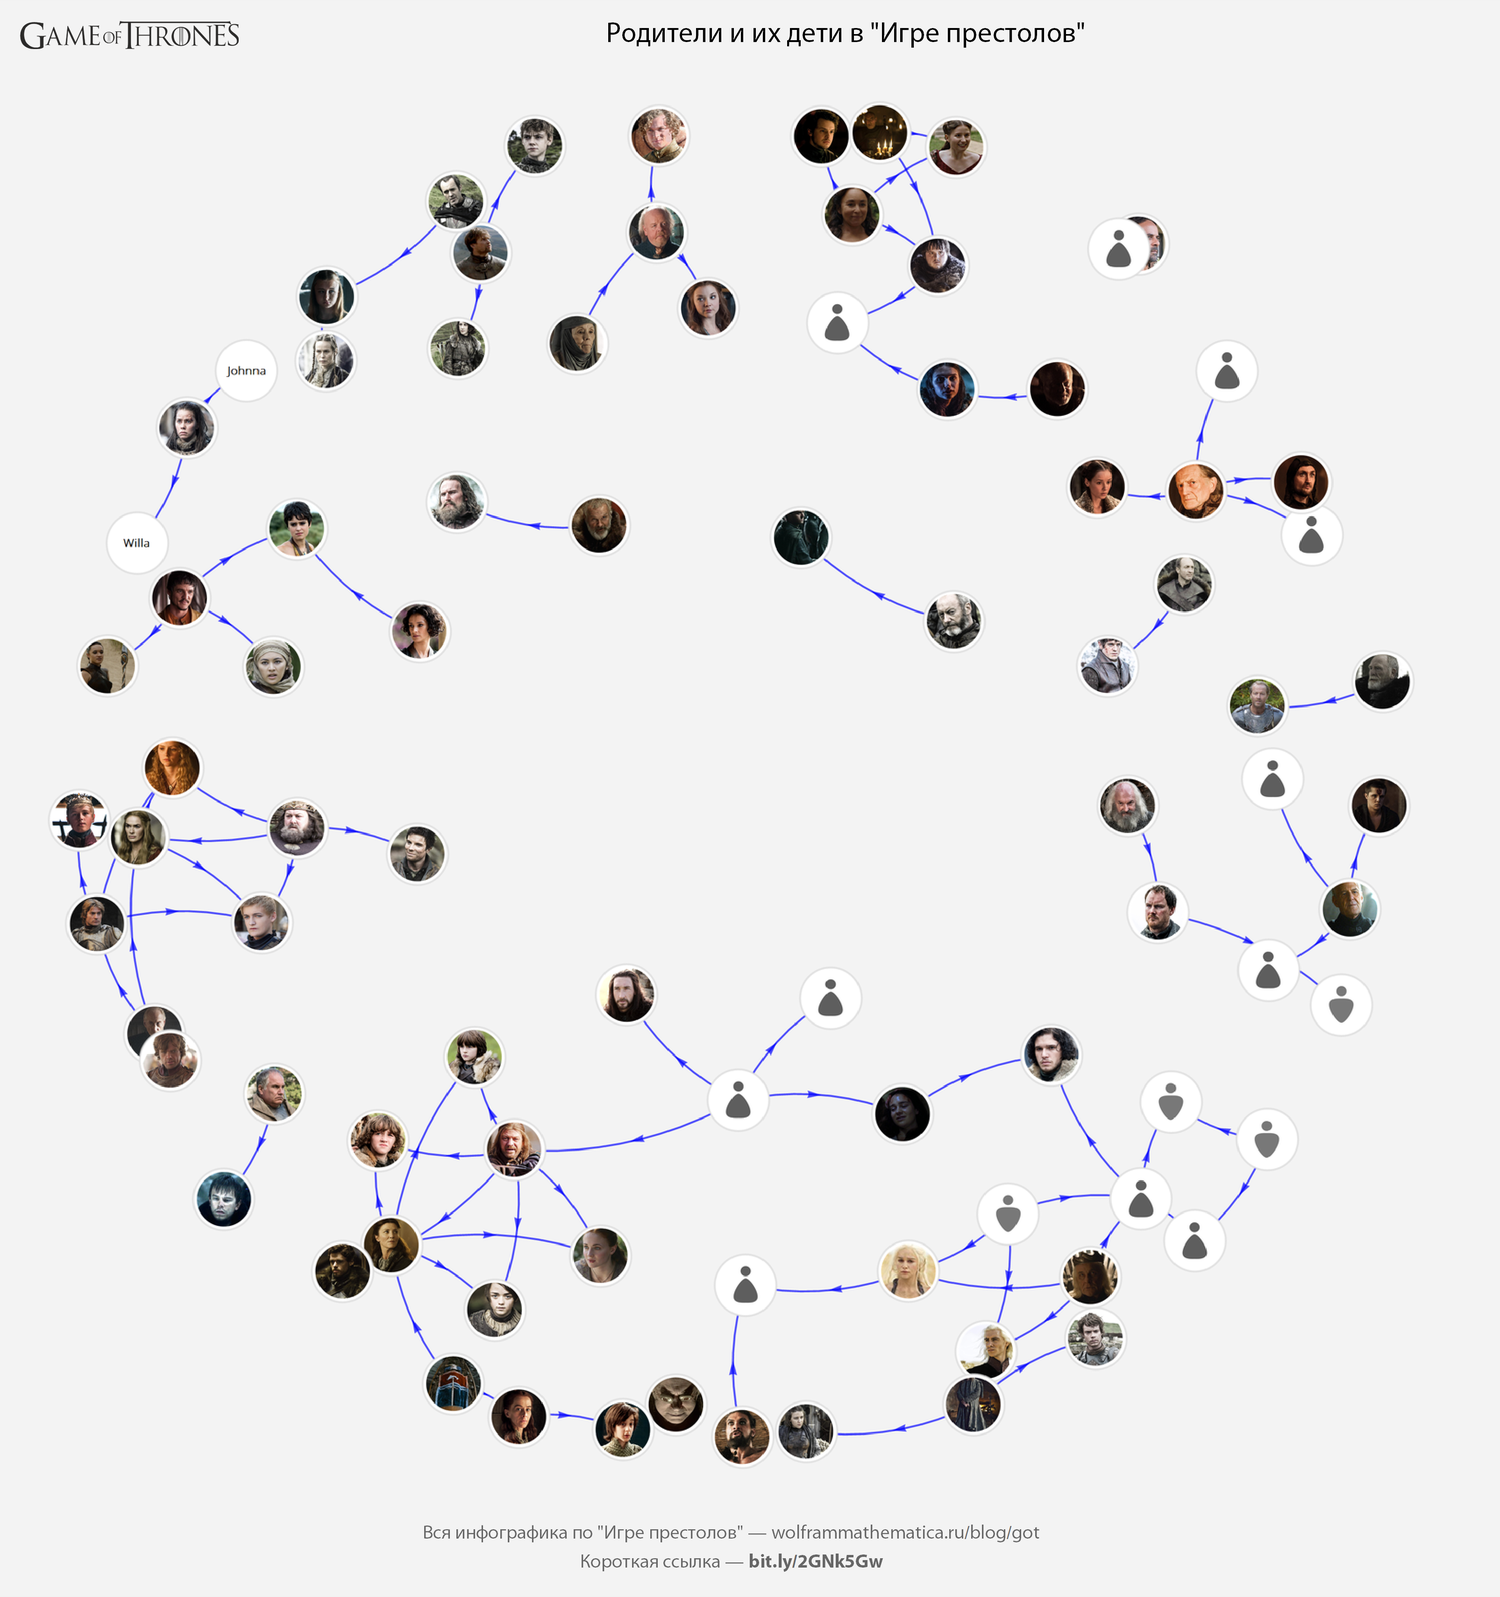
Descobrimos quem deu à luz quem em Game of Thrones:
GOTInfographicsPoster[ #, " \" \"", "ImageSize" -> 1500 ] &@ GOTCharacterLinksGraph[ Property[ #, { EdgeStyle -> Directive[ { AbsoluteThickness[2], Blue, Arrowheads[{0, {0.01, 0.5}}] } ] } ] & /@ $GOTCharacterLinks[""], "VertexSize" -> 3 ]
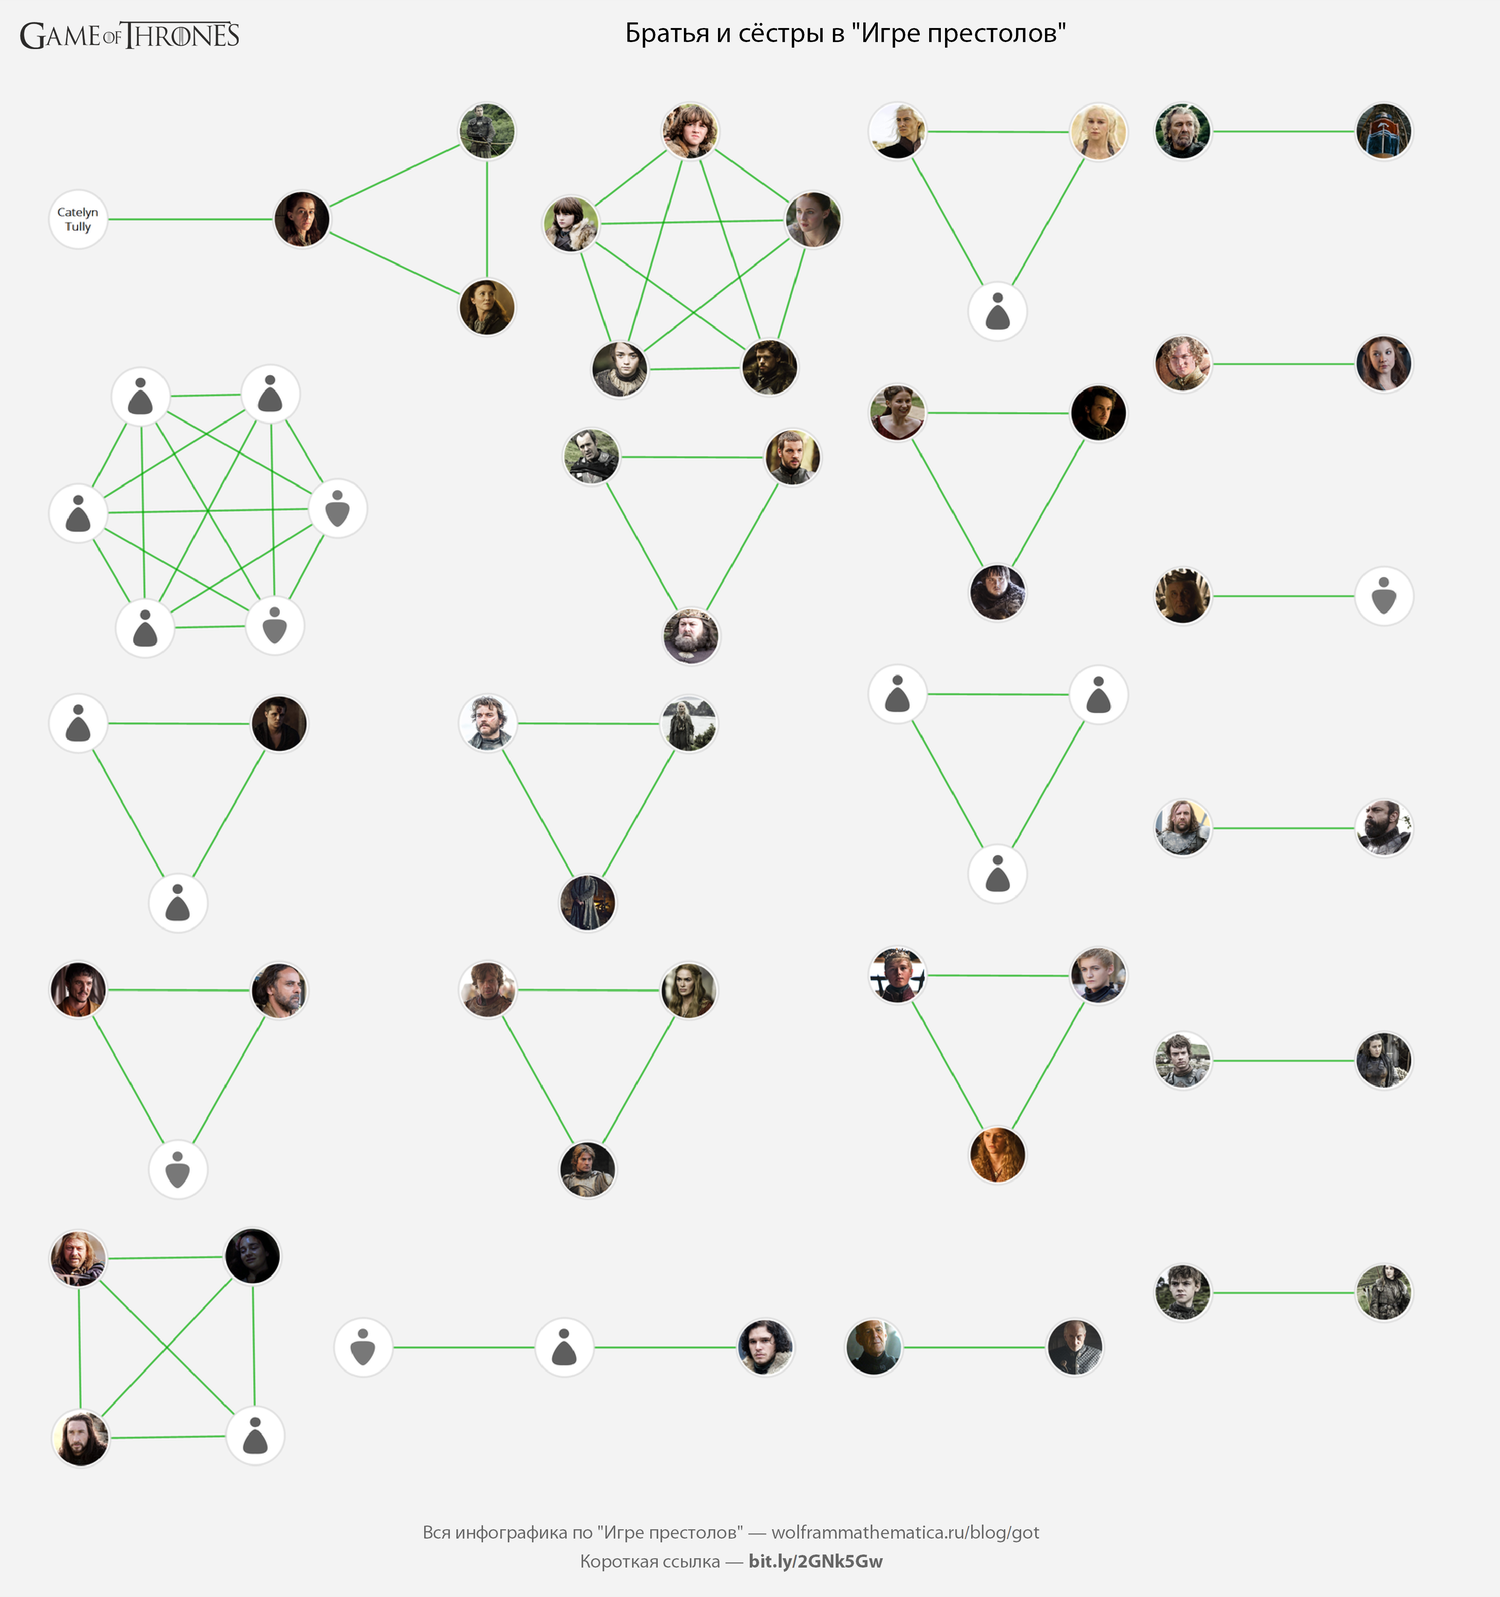
Agora vamos ver quem é irmão ou irmã a quem no Game of Thrones:
GOTInfographicsPoster[ #," \" \"","ImageSize"->1500 ]&@ GOTCharacterLinksGraph[ Property[ #, {EdgeStyle->Directive[{AbsoluteThickness[2],Darker@Green}]} ]&/@ $GOTCharacterLinks[""], "VertexSize"->0.7, "GraphLayout"->Automatic ]
Um dos mais interessantes: a contagem de assassinatos em Game of Thrones:
GOTInfographicsPoster[ #," \" \"","ImageSize"->2500 ]&@ GOTCharacterLinksGraph[ Property[ #, { EdgeStyle-> Directive[ { AbsoluteThickness[2], Black, Arrowheads[{0,{0.0075,0.5}}] } ] } ]&/@ $GOTCharacterLinks[""], "VertexSize"->1.1, "ImageSize"->2500 ]
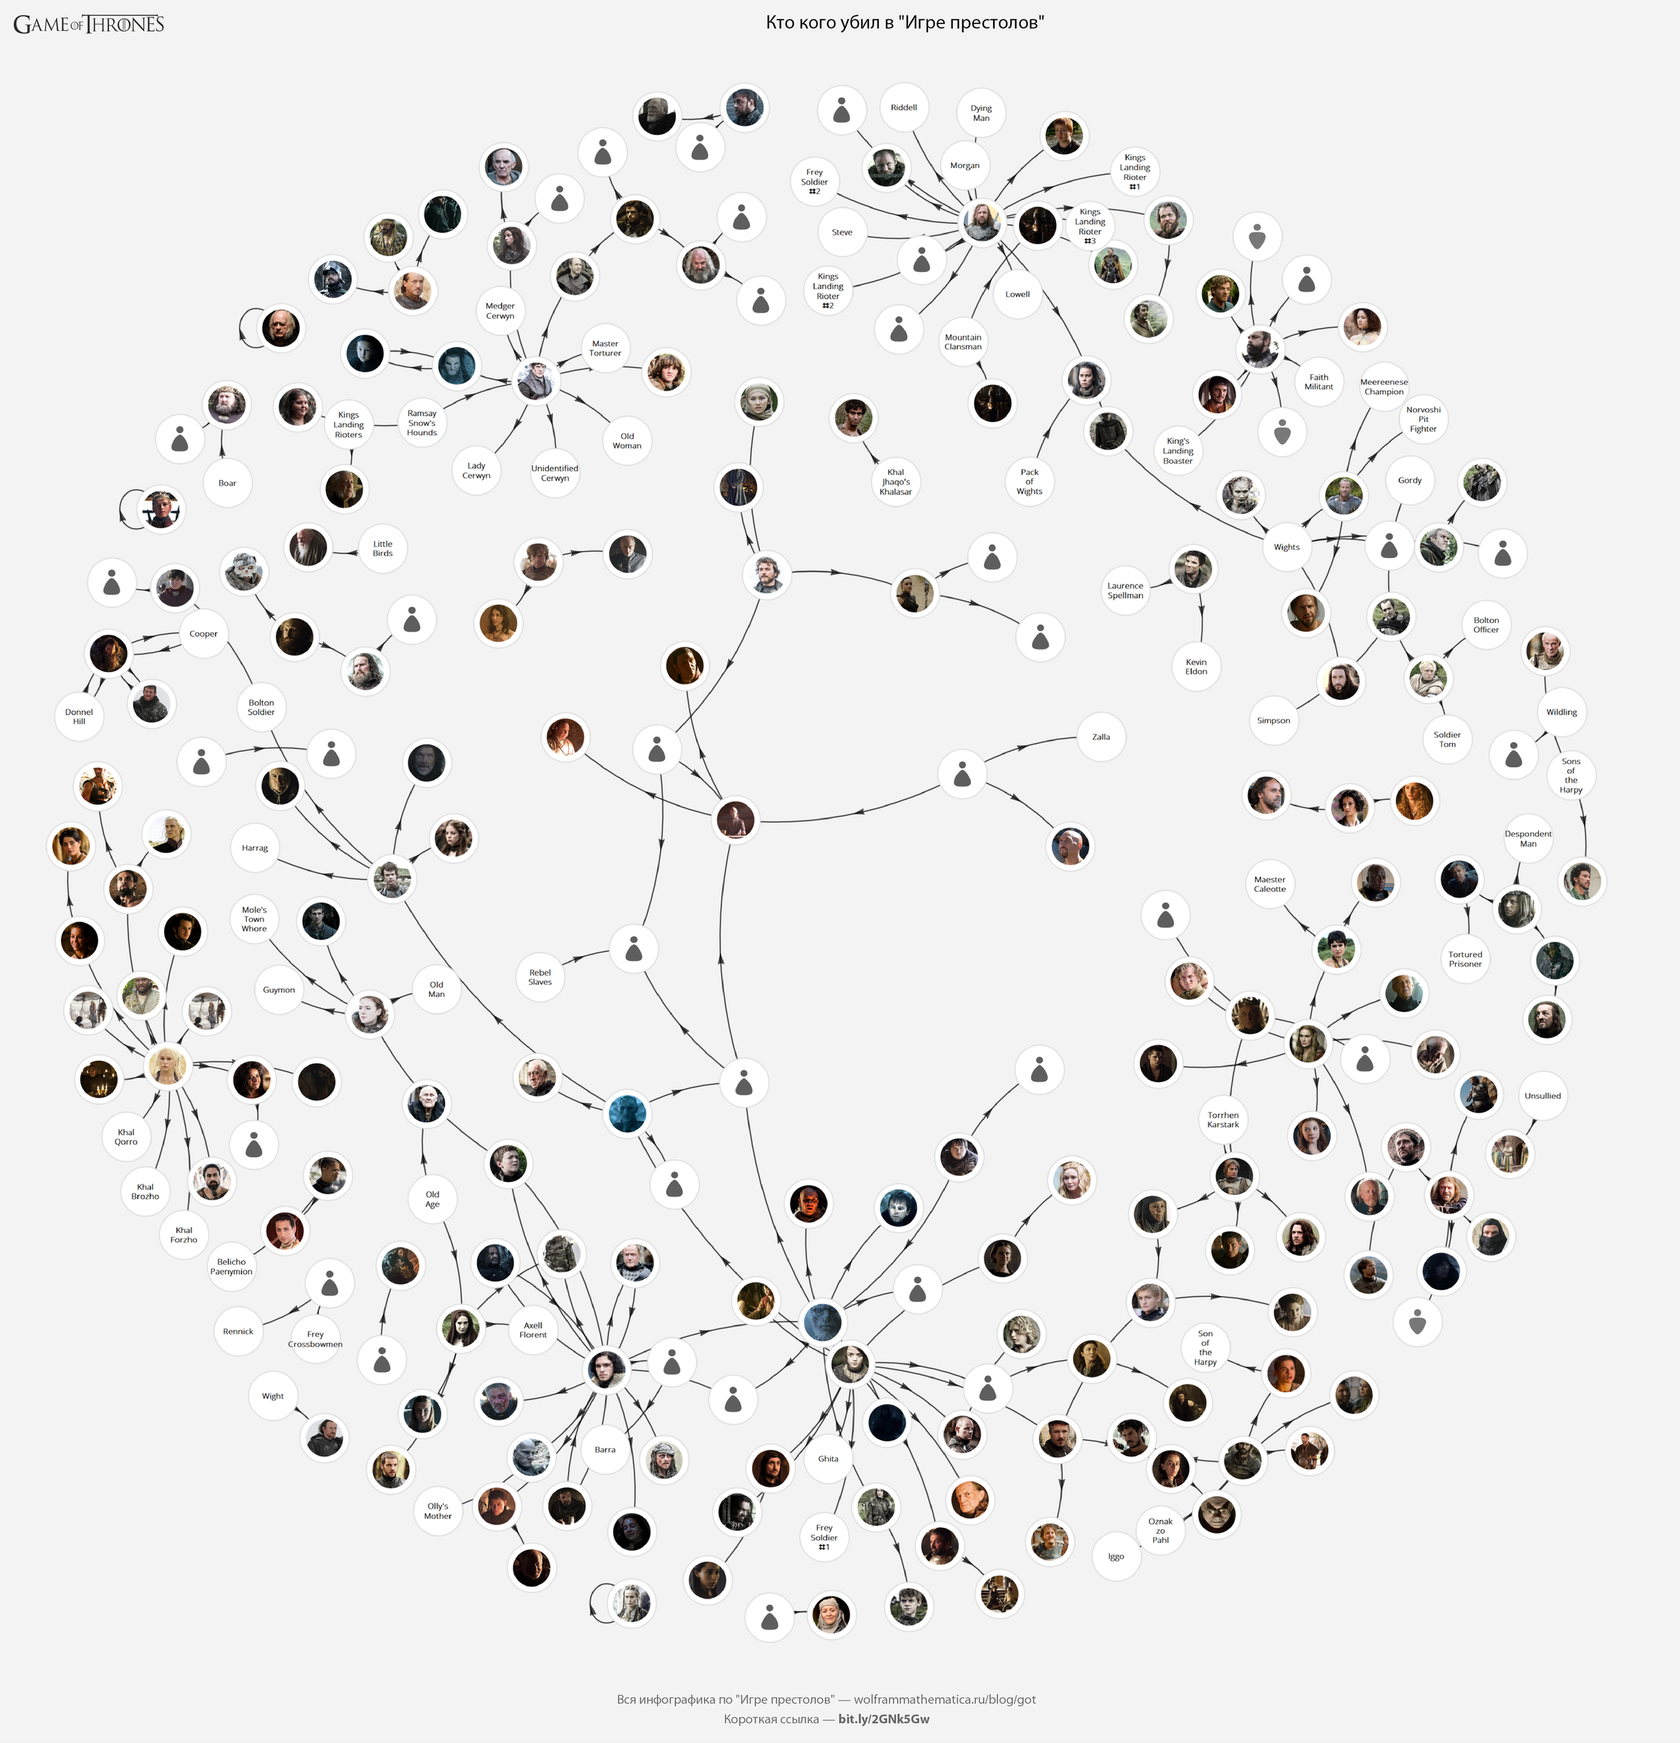
(
original )
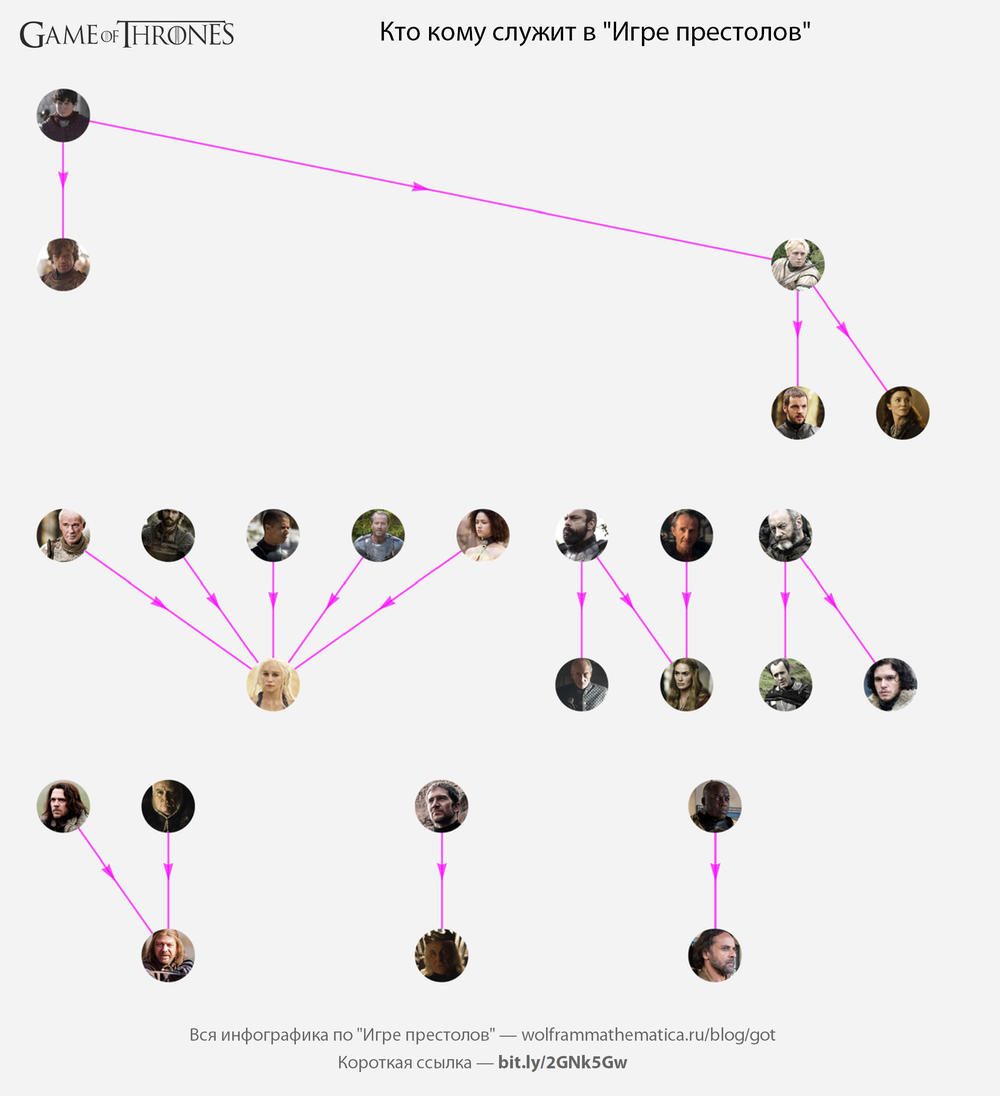
Não é tão interessante, mas mesmo assim - quem serve a quem em Game of Thrones:
GOTInfographicsPoster[ #," \" \"","ImageSize"->1000 ]&@ GOTCharacterLinksGraph[ Property[ #, { EdgeStyle-> Directive[ { AbsoluteThickness[2], Magenta, Arrowheads[{0,{0.02,0.5}}] } ] } ]&/@ $GOTCharacterLinks[""], "VertexSize"->0.5, "ImageSize"->1000, "GraphLayout"->Automatic ]
Os personagens envolvidos e casados de Game of Thrones:
GOTInfographicsPoster[ #, " \" \"", "ImageSize"->1000 ]&@ GOTCharacterLinksGraph[ Property[ #,{EdgeStyle->Directive[{AbsoluteThickness[2],Orange}]} ]&/@ $GOTCharacterLinks[""], "VertexSize"->0.5, "ImageSize"->1000, "GraphLayout"->Automatic ]

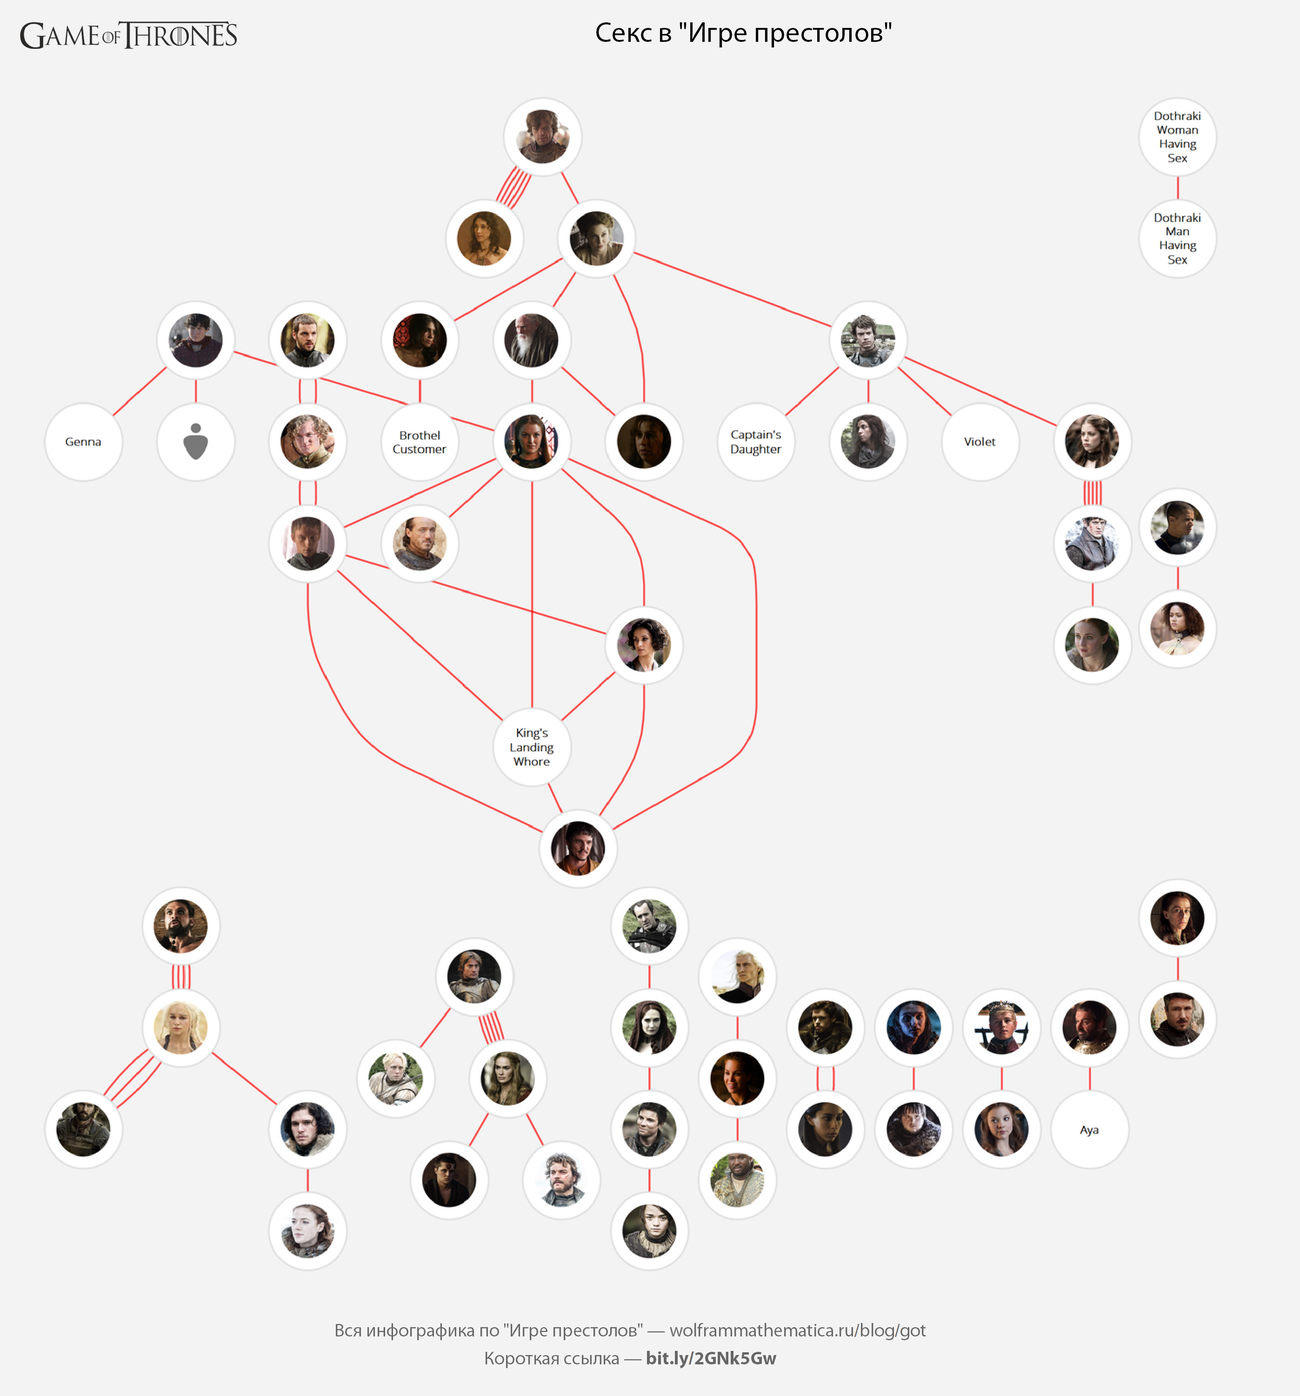
Um pouco mais quente - quem fez sexo com quem no Game of Thrones (acho que o número de falas não é difícil de adivinhar o que significa;)).
GOTInfographicsPoster[#, " \" \"", "ImageSize" -> 1300] &@ GOTCharacterLinksGraph[ Property[#, {EdgeStyle -> Directive[{AbsoluteThickness[2], Red}]}] & /@ $GOTCharacterLinks[""], "VertexSize" -> 0.9, "ImageSize" -> 1300, "GraphLayout" -> "LayeredDigraphEmbedding" ]
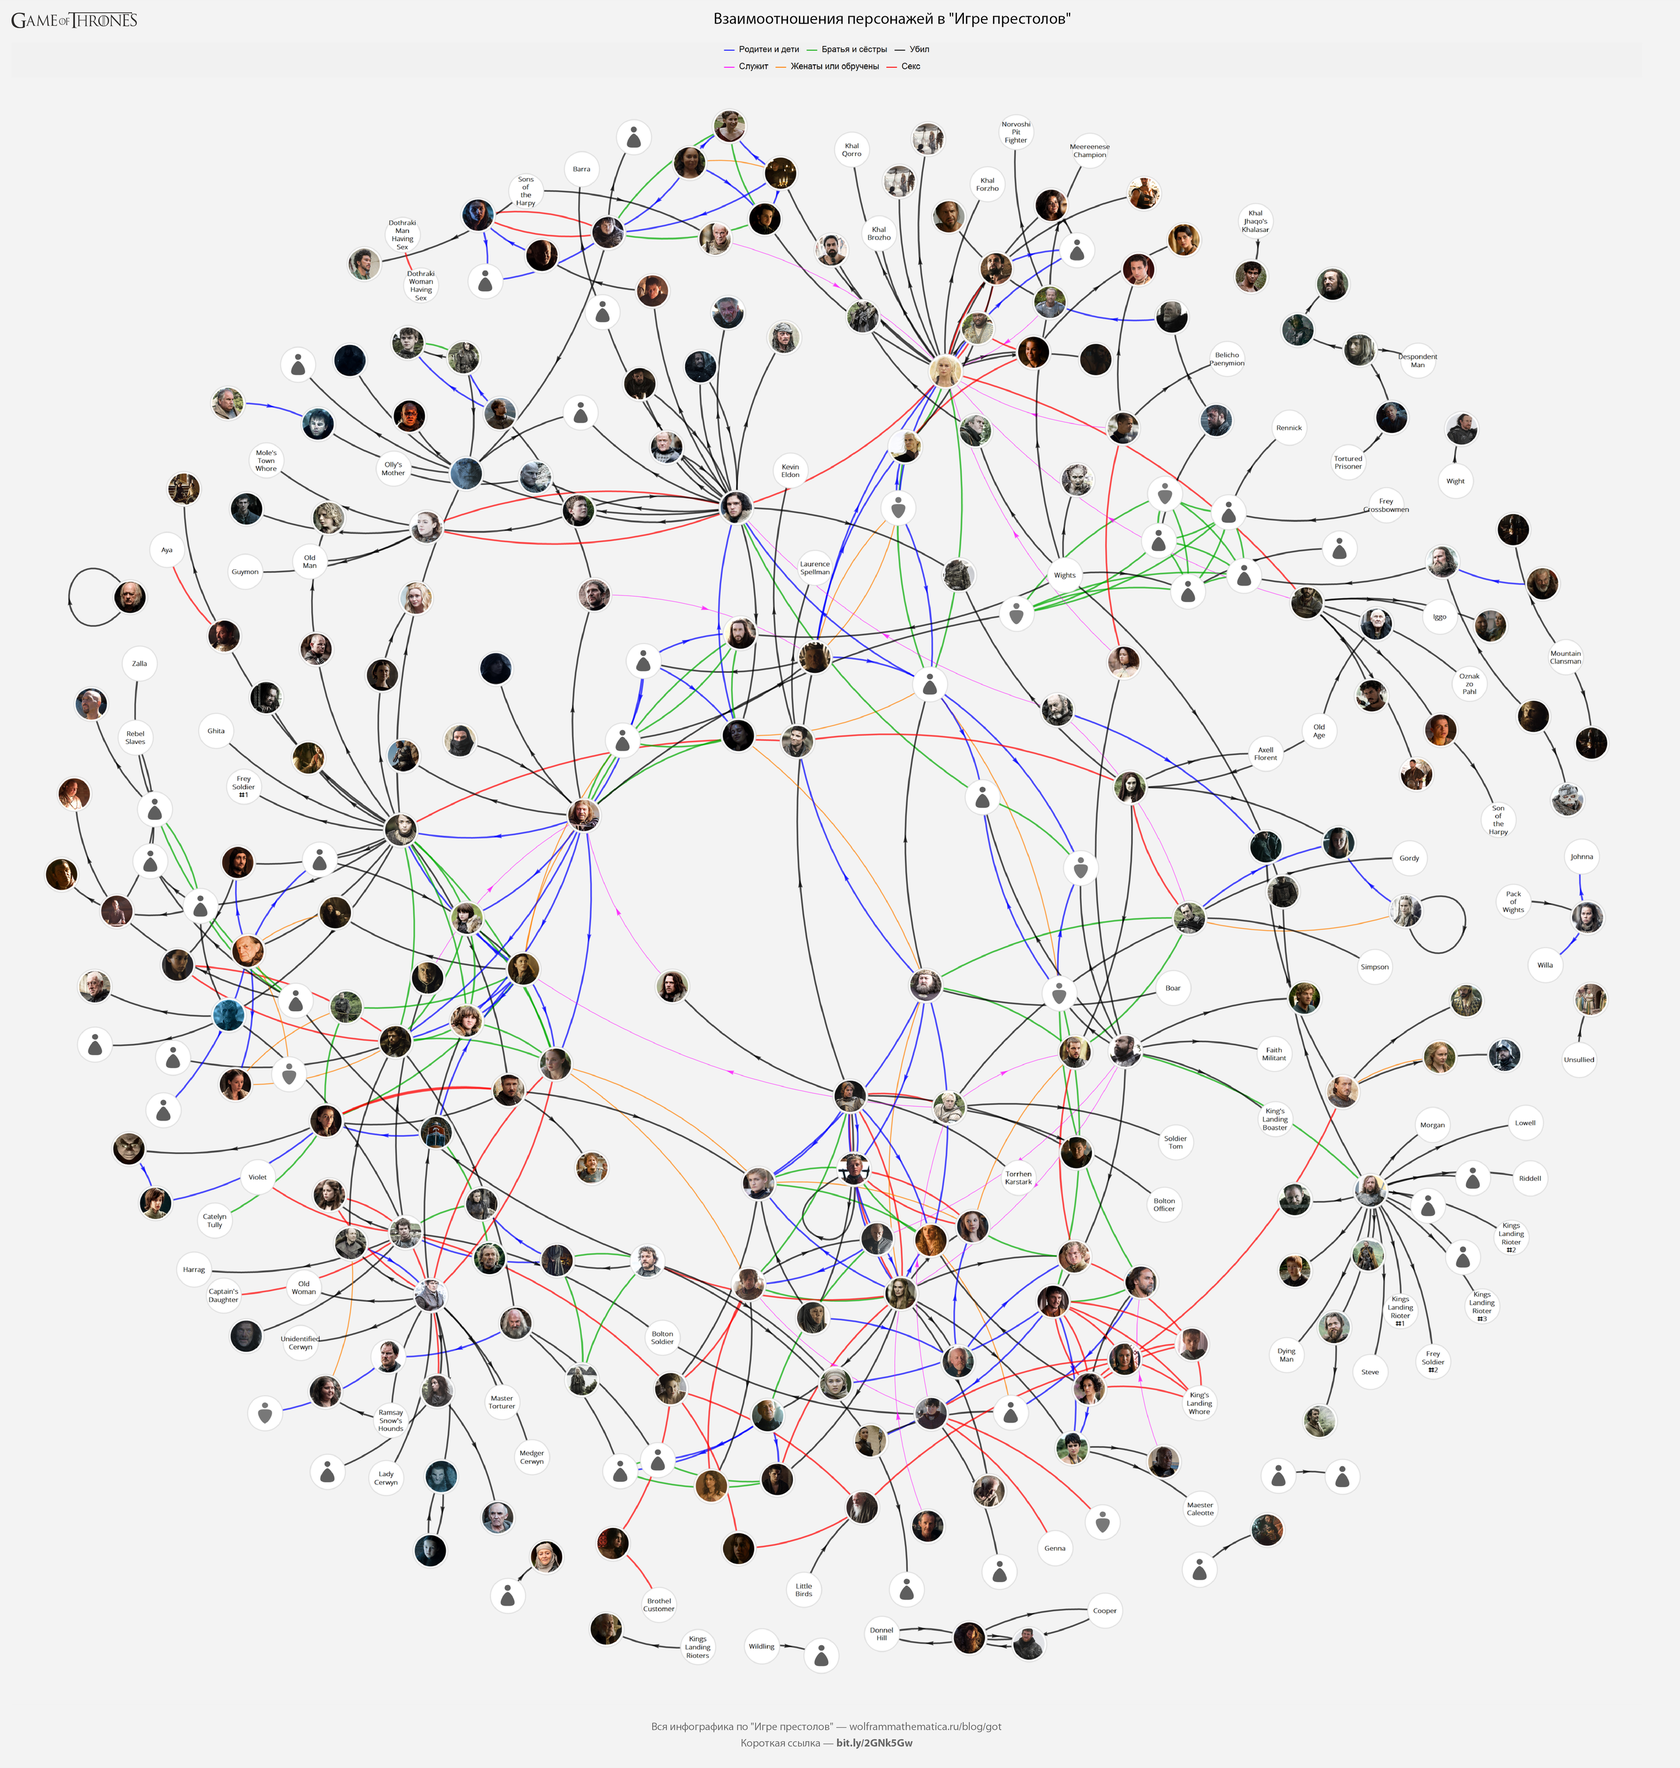
Agora vamos reduzir todos os gráficos em um grande gráfico da relação dos personagens em "Game of Thrones":
GOTInfographicsPoster[ #, " \" \"", "ImageSize"->3000 ]&@ Legended[ GOTCharacterLinksGraph[ Join[ Property[ #, { EdgeStyle-> Directive[ { AbsoluteThickness[3], Blue, Arrowheads[{0,{0.005,0.5}}] } ] } ]&/@ $GOTCharacterLinks[""], Property[ #, { EdgeStyle-> Directive[ {AbsoluteThickness[3],Darker@Green} ] } ]&/@ $GOTCharacterLinks[""], Property[ #, { EdgeStyle-> Directive[ { AbsoluteThickness[3], Black, Arrowheads[{0,{0.005,0.5}}] } ] } ]&/@ $GOTCharacterLinks[""], Property[ #, { EdgeStyle-> Directive[ { AbsoluteThickness[1], Magenta, Arrowheads[{0,{0.005,0.5}}] } ] } ]&/@ $GOTCharacterLinks[""], Property[ #, { EdgeStyle-> Directive[{AbsoluteThickness[2],Orange}] } ]&/@ $GOTCharacterLinks[""], Property[ #, {EdgeStyle->Directive[{AbsoluteThickness[3],Red}]} ]&/@ DeleteDuplicates[$GOTCharacterLinks[""]] ], "ImageSize"->3000, "VertexSize"->0.9 ], Placed[ LineLegend[ {Blue,Darker@Green,Black,Magenta,Orange,Red}, { " ", " ", "", "", " ", "" }, LegendLayout->"Row" ], Top ] ]
(
original )
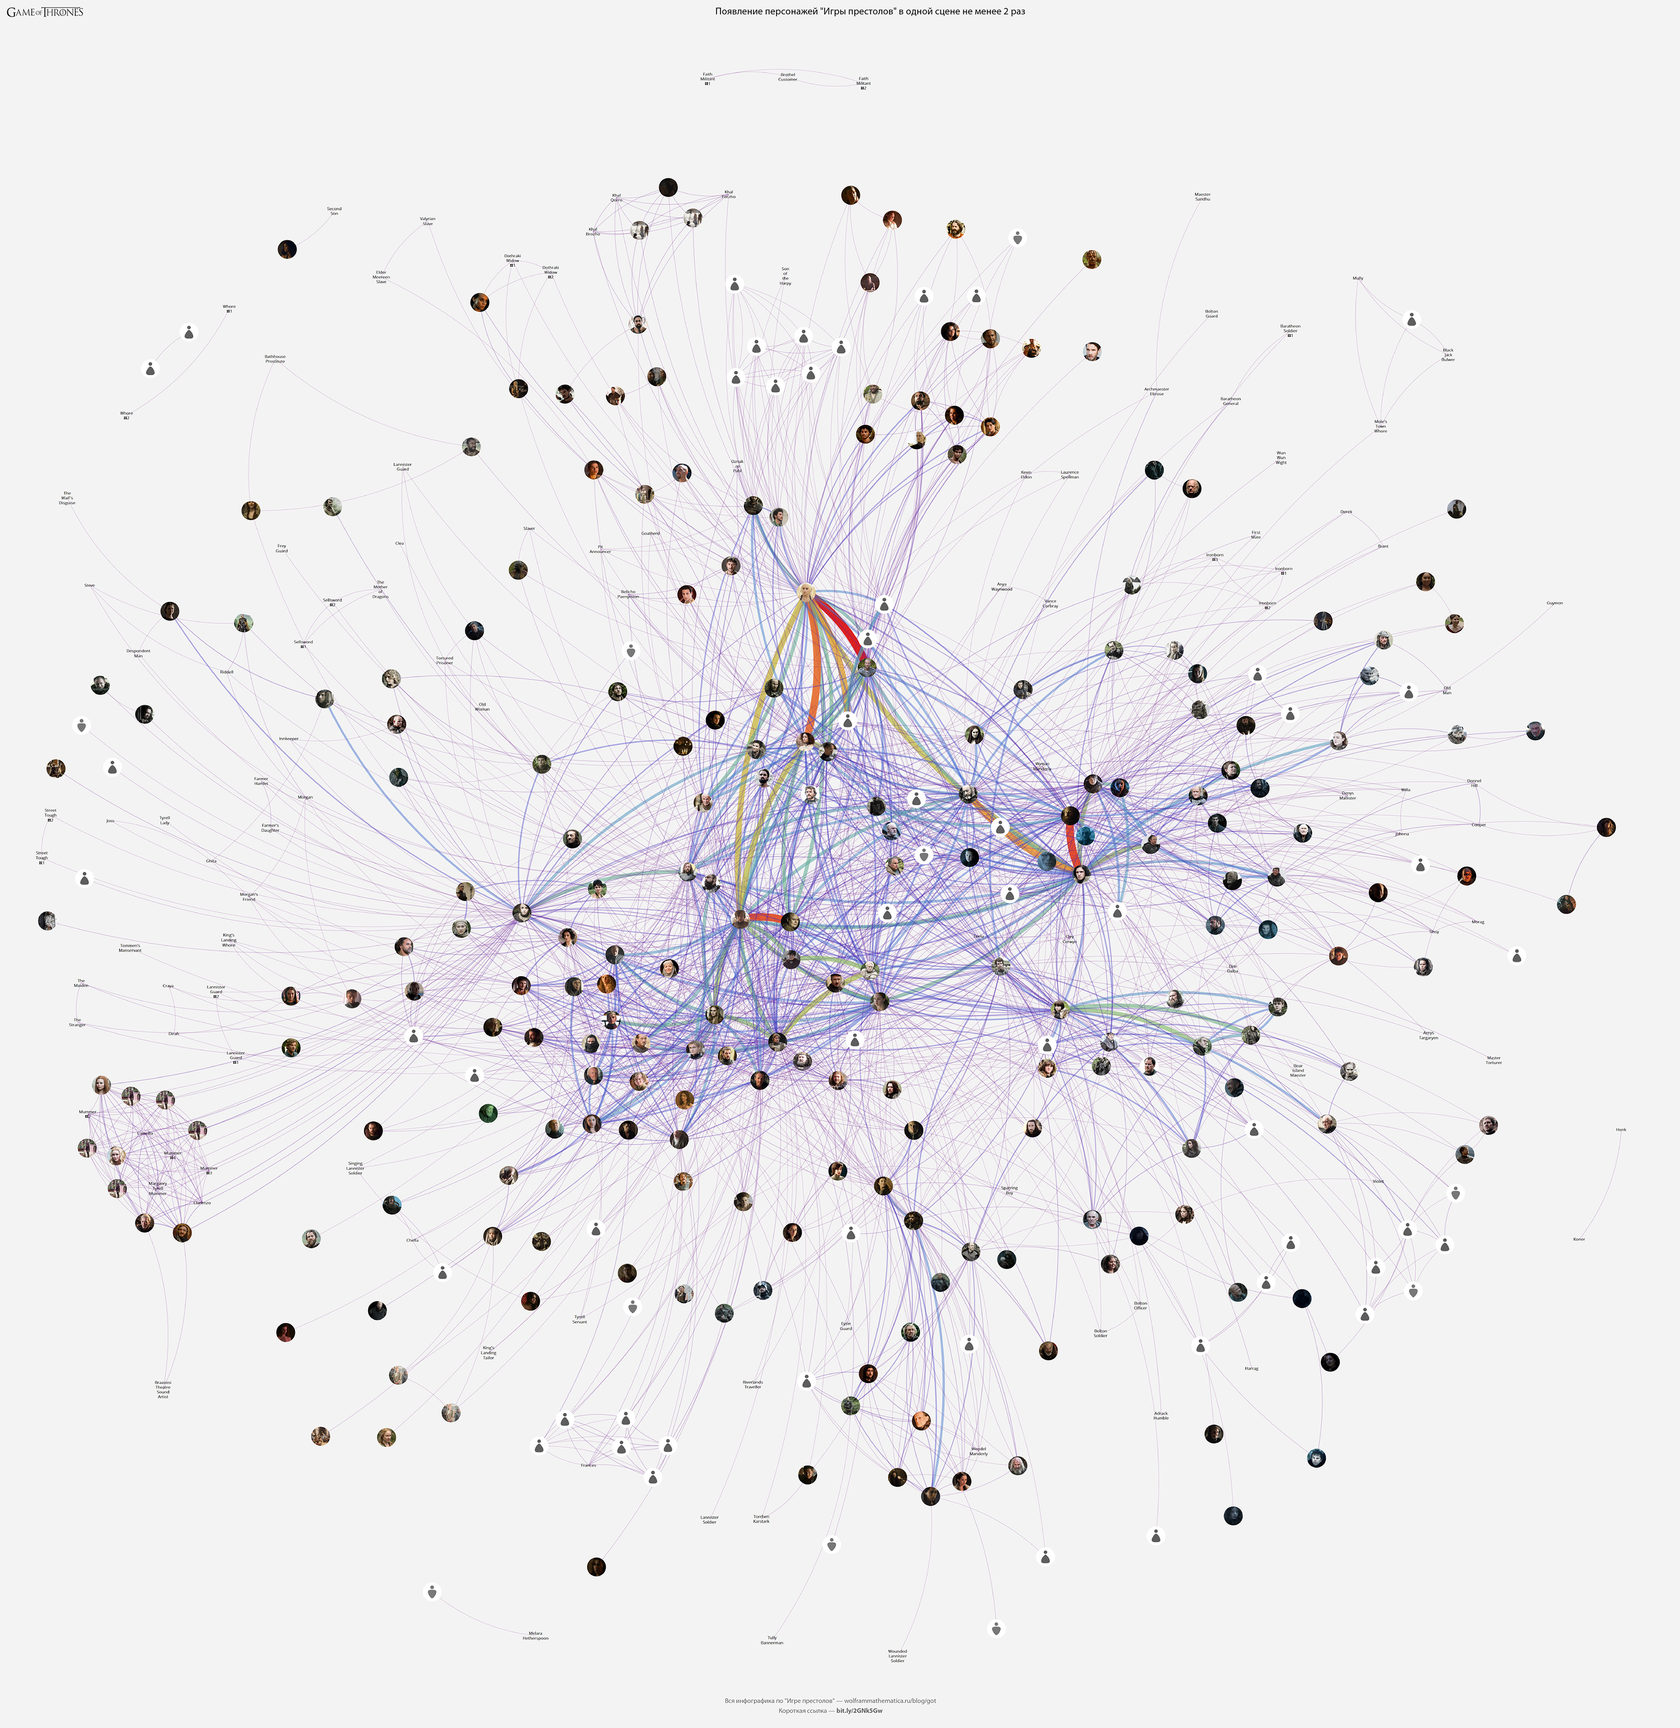
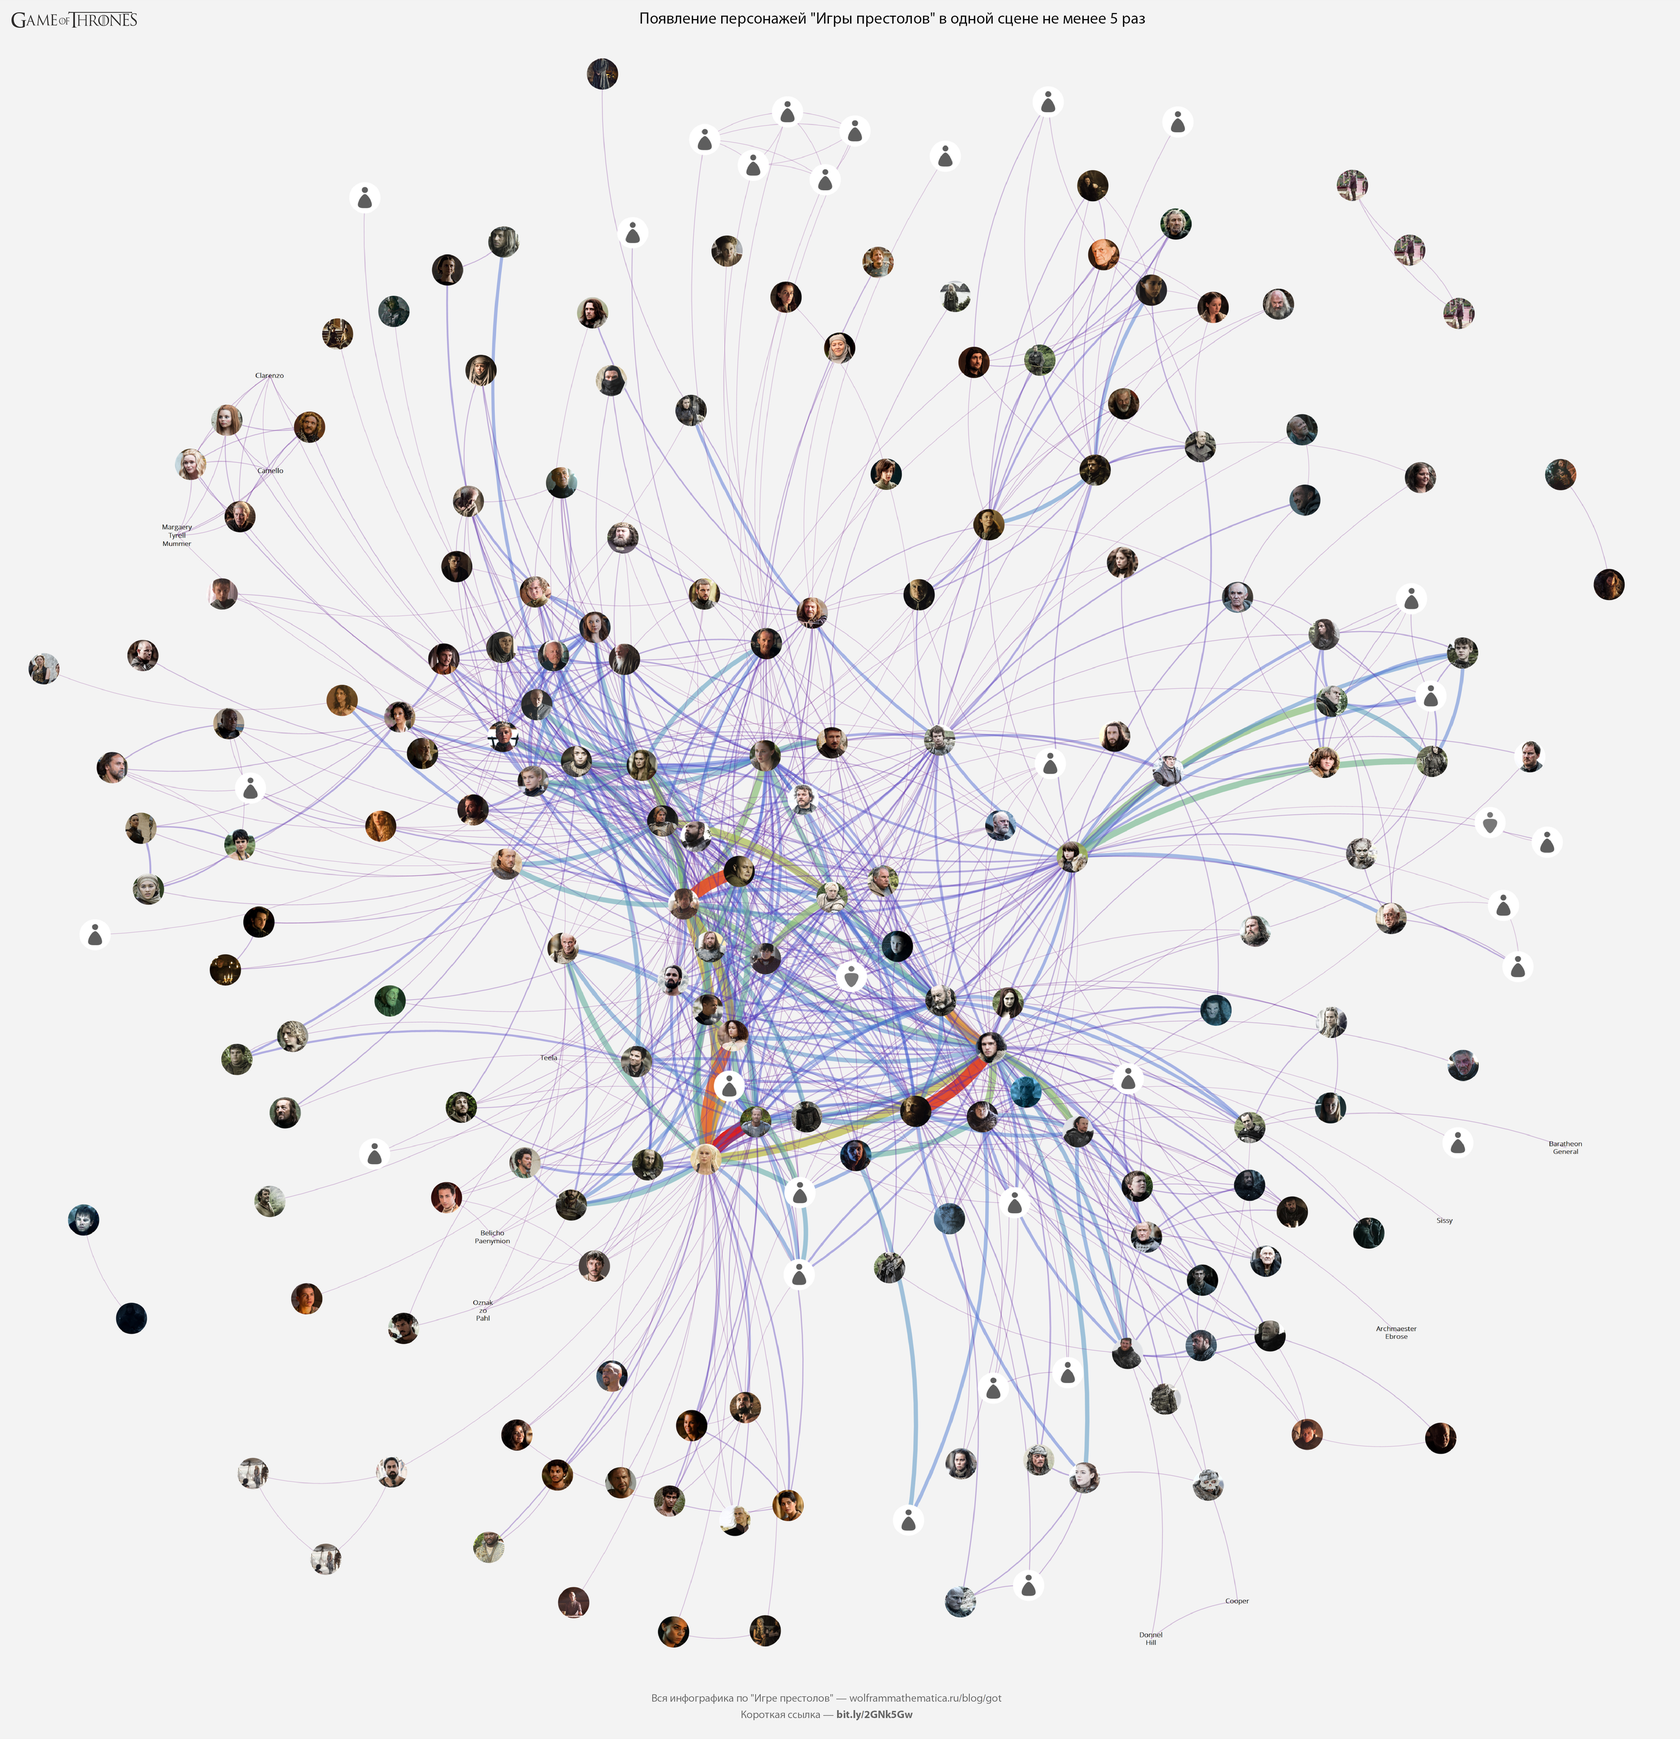
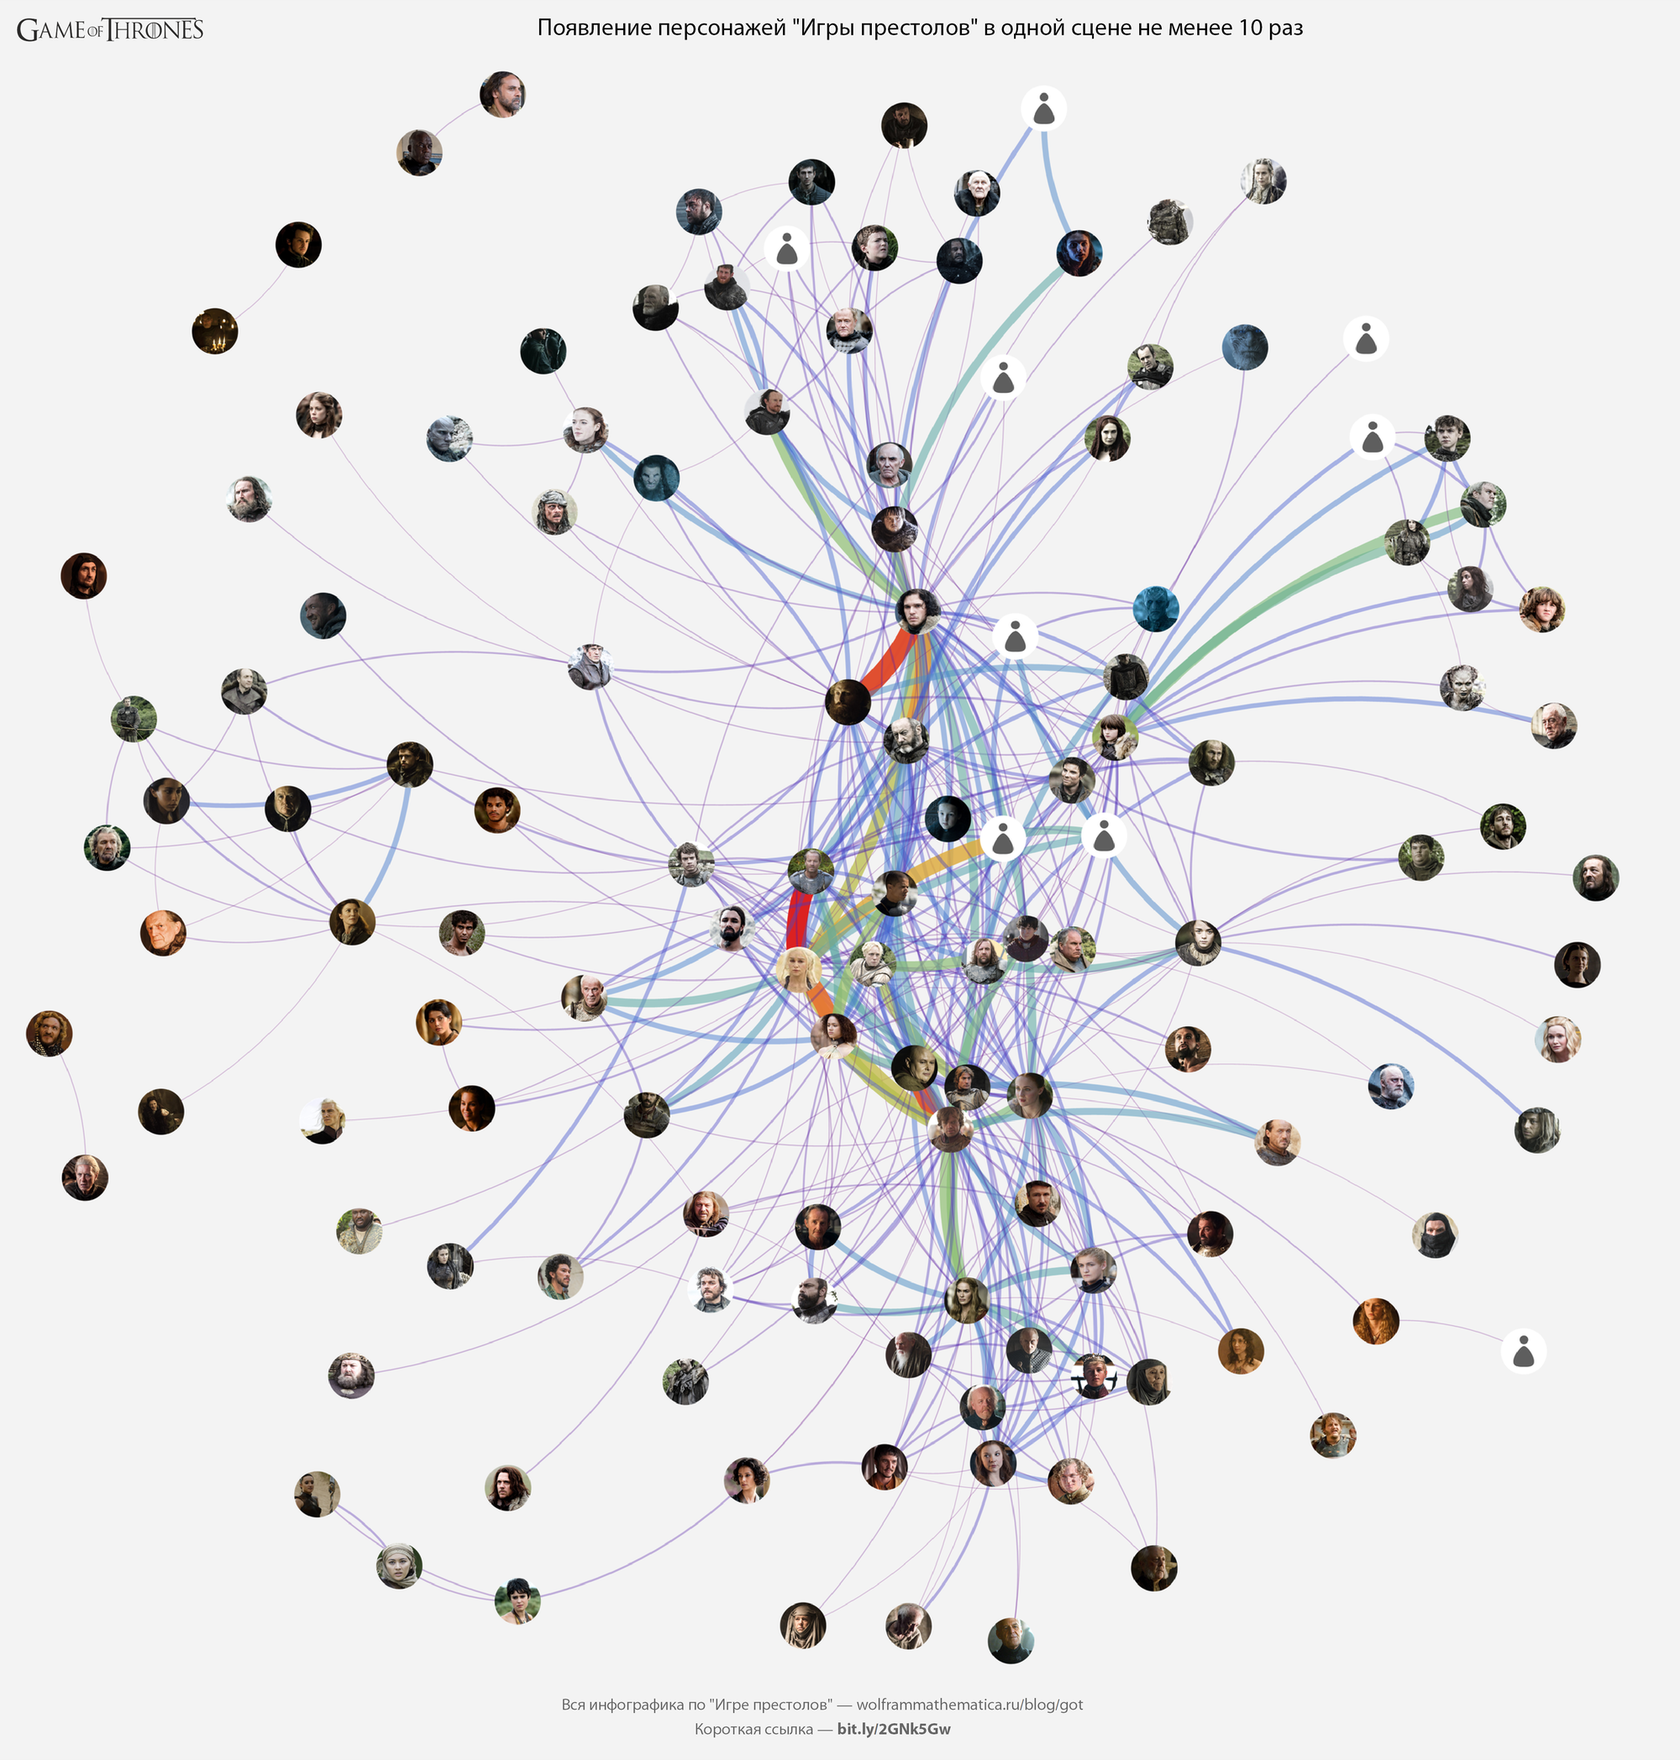
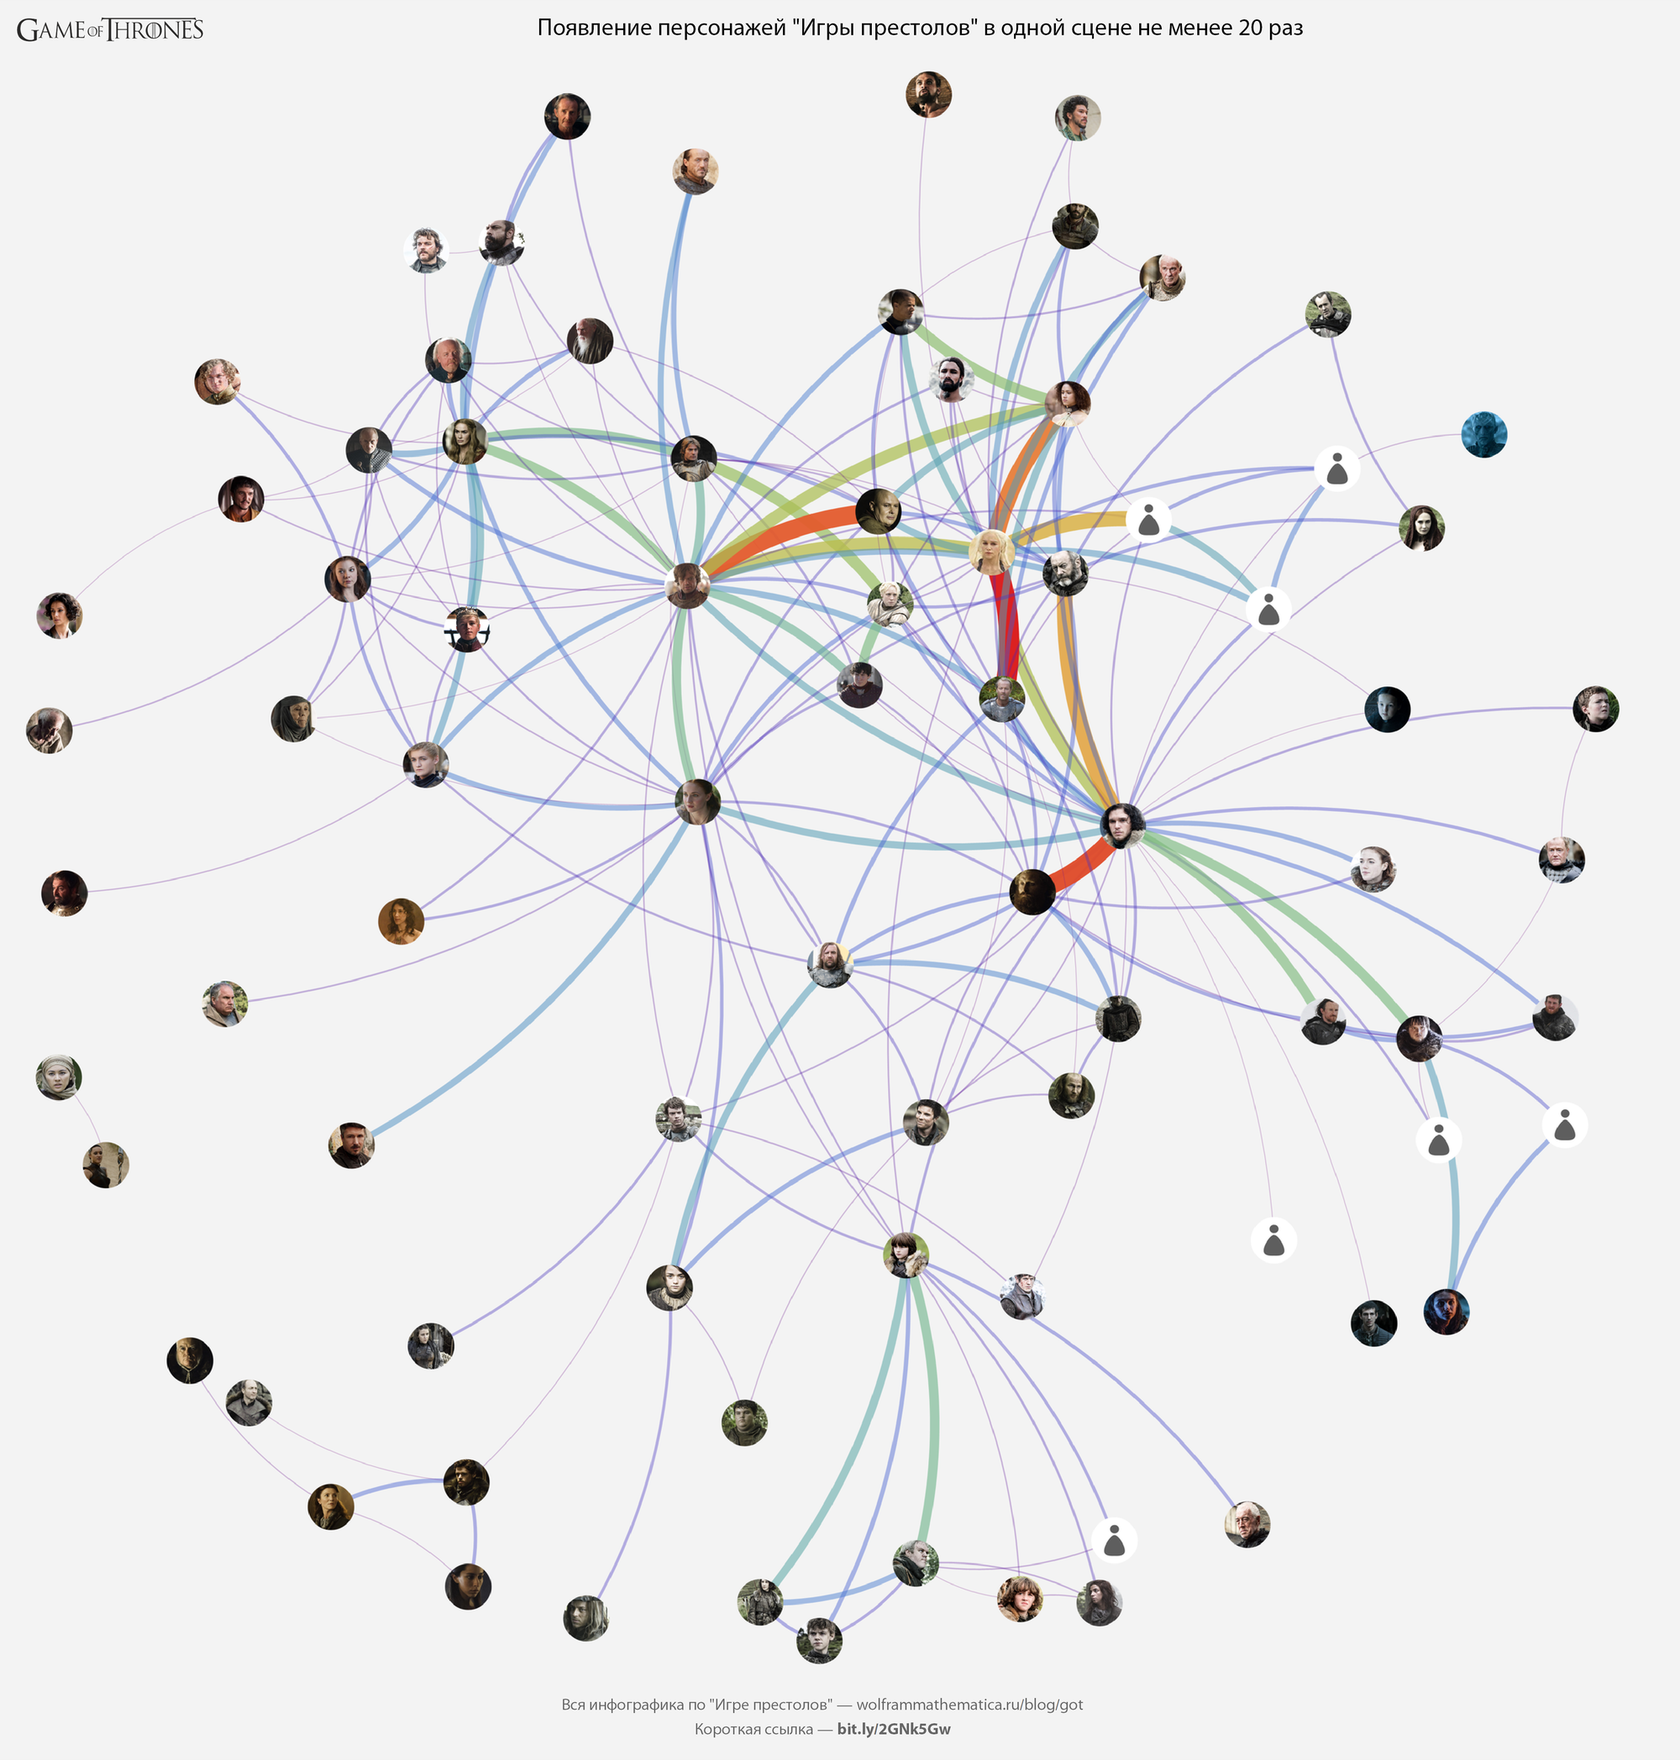
Vinculando caracteres por cena
Vejamos quais personagens apareceram na mesma cena. Cada aresta entre os personagens significa que eles estavam na mesma cena. Quanto mais grossa e mais vermelha a costela, as cenas mais comuns.
Vamos criar vários gráficos: o primeiro mostra conexões com um número mínimo de cenas 2. Em seguida, 5, 10 e 20.
Table[ Print[ GOTInfographicsPoster[ GOTGraphPlot[ #, min, "ImageSize"->Which[min==1,5000,min==4,3000,True,2000], "MaxThickness"->25 ], " \" \" " <> ToString[min+1] <> " ", "ImageSize"->Which[min==1,5000,min==4,3000,True,2000] ]&@ Tally[ UndirectedEdge@@@ Map[ Sort, Flatten[ Map[ Subsets[#,{2}]&, Map[ #[[;;,"name"]]&, Flatten[ Lookup[ GOTRawData[ "episodes.json" ][ "episodes" ], "scenes" ] ][ [;;,"characters"] ] ] ], 1 ] ] ] ], {min,{1,4,9,19}} ];
(
original )
Quem é o personagem mais "popular" de Game of Thrones?
Para responder a essa pergunta, crie uma variável
$ GOTEpisodeData na qual
colocaremos um conjunto de dados de cena limpos para cada episódio de Game of Thrones.
$GOTEpisodeData= With[{data=#}, <| "EpisodeN"->#[[1]], "ScreenTime"-> SortBy[ GroupBy[ Flatten[ ReplaceAll[ Thread/@ Transpose[ { Map[ Lookup[#[[1]],"name"]&, #[[2]] ], Round@ Map[ QuantityMagnitude[ UnitConvert[ Subtract@@ ( TimeObject/@ #[ [ { 3, 2 } ] ] ), "Seconds" ] ]&, #[[2]] ] } ], {Missing["KeyAbsent","name"],x_} :> {{"",x}} ]&@ data, 1 ], First, #[[;;,2]]& ], -Total[#]& ], "LocationTime" -> SortBy[ GroupBy[ Flatten[ ReplaceAll[ Thread/@ Transpose[ { Map[{#[[{4,5}]]}&,#[[2]]] /. Missing["KeyAbsent","subLocation"]-> Nothing, Round@ Map[ QuantityMagnitude[ UnitConvert[ Subtract@@ ( TimeObject/@ #[ [ { 3, 2 } ] ] ), "Seconds" ] ]&, #[[2]] ] } ], {Missing["KeyAbsent","name"],x_} :> {{"",x}} ]&@ data, 1 ], First, #[[;;,2]]& ], -Total[#]& ], "CharacterLocations"-> GroupBy[ DeleteCases[ #/.Missing["KeyAbsent","subLocation"]->Nothing, _Missing ]&@ Flatten[ Map[ With[{location=#[[2]]}, {#,location}&/@#[[1]] ]&, Transpose[ { Map[Lookup[#[[1]],"name"]&,#[[2]]], #[[2,;;,{4,5}]] } ] ], 1 ], First, #[[;;,2]]& ]|> ]&/@ DeleteCases[ Map[ { #[[{1,2}]], Lookup[ #[[3]], { "characters", "sceneStart", "sceneEnd", "location", "subLocation" } ] }&, Lookup[ GOTRawData["episodes.json"]["episodes"], {"seasonNum","episodeNum","scenes"} ] ], {_,{_Missing...}} ];
Dados de exemplo para o primeiro episódio da primeira temporada:

A quantidade de tempo na tela para caracteres
30 personagens de Game of Thrones com mais tempo de tela:
GOTInfographicsPoster[ #, "30 , ", "ImageSize"->1500 ]&@ circleInfographics[ { Tooltip[ Row[ { #[[1]]/.$characterImage, Style[#[[1]],14,White,Bold], Style[ UnitConvert[ Quantity[#[[2]],"Seconds"], MixedUnit[ {"Hours","Minutes","Seconds"} ] ], 14, White ] }, "\n" ], #[[1]]/.$characterCardFull ], #[[2]] }&/@ KeyValueMap[ {#1,#2}&, SortBy[ Merge[ $GOTEpisodeData[[All,"ScreenTime"]], Total[Flatten[#]]& ], -#& ] ][ [1;;30] ], "Precision"->10^-6, "StepDecrease"->0.99, "ShapeFunction"->Disk, "ColorFunction"->ColorData["Rainbow"], "ImageSize"->1500 ]

(
original )
Também não privaremos os outros e construiremos uma tabela grande:
GOTInfographicsPoster[ #, "550+ ", "ImageSize"->1500, "ImageResolution"->150 ]&@ Multicolumn[ Style[ Row[{#[[1]]," \[LongDash] ",#[[2]]," c"}],FontFamily->"Myriad Pro",8 ]&/@ KeyValueMap[ {#1,#2}&, SortBy[ Merge[ $GOTEpisodeData[[All,"ScreenTime"]], Total[Flatten[#]]& ], -#& ] ], 6 ]

(
original )
Quantos caracteres havia na série?
$ GOTEpisodeN -
Converte uma série do formato
{temporada, número de série de uma série em uma temporada} para apenas o número de série de uma série em toda a série.
$GOTEpisodeN= <| Thread[ Rule[#,Range[Length[#]]]&@$GOTEpisodeData[[All,"EpisodeN"]] ]|>;
$ GOTEpisodeID é a operação inversa a
$ GOTEpisodeN .
$GOTEpisodeID= <| Thread[ Rule[Range[Length[#]],#]&@$GOTEpisodeData[[All,"EpisodeN"]] ]|>;
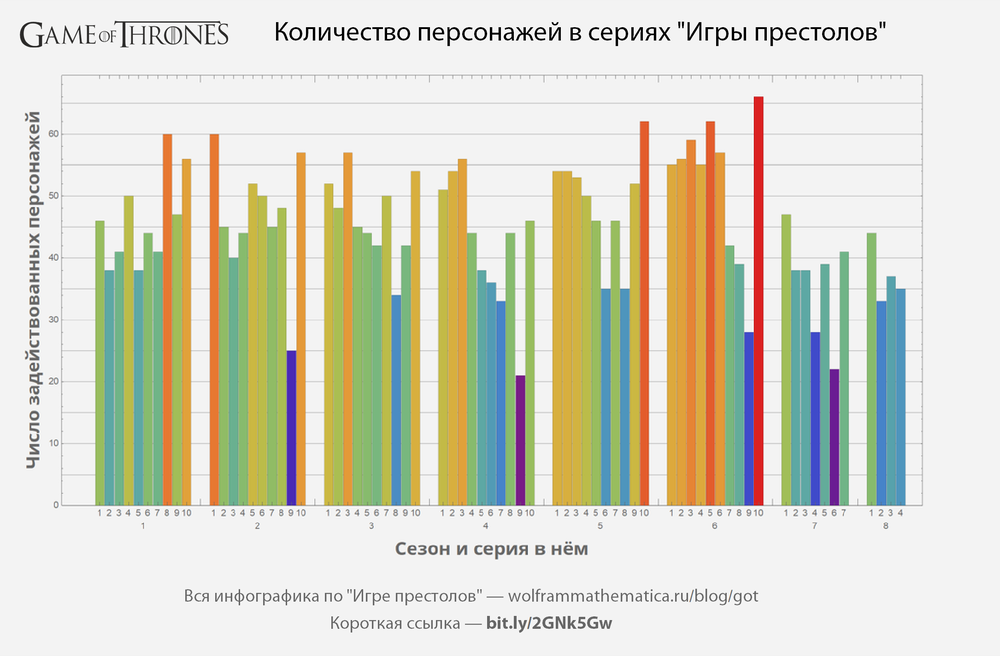
Vamos construir um histograma do número de personagens envolvidos em cada uma das séries de Game of Thrones
GOTInfographicsPoster[ #, " \" \"", "ImageSize"->1000 ]&@ BarChart[ #, BarSpacing->{0.05,2}, AspectRatio->1/2, ImageSize->1000, ChartLabels->{Keys[#],Range[10]}, ColorFunction->Function[{x},ColorData["Rainbow"][x]], GridLines->{None,Range[0,100,5]}, FrameLabel-> Map[ Style[#,FontFamily->"Open Sans",20,Bold]&, { " ", " " } ], Frame->True, Background->GrayLevel[0.95] ]&@ GroupBy[ Map[ {#["EpisodeN"],Length[#["ScreenTime"]]}&, $GOTEpisodeData[[All,{"EpisodeN","ScreenTime"}]] ], #[[1,1]]&, #[[;;,2]]& ]
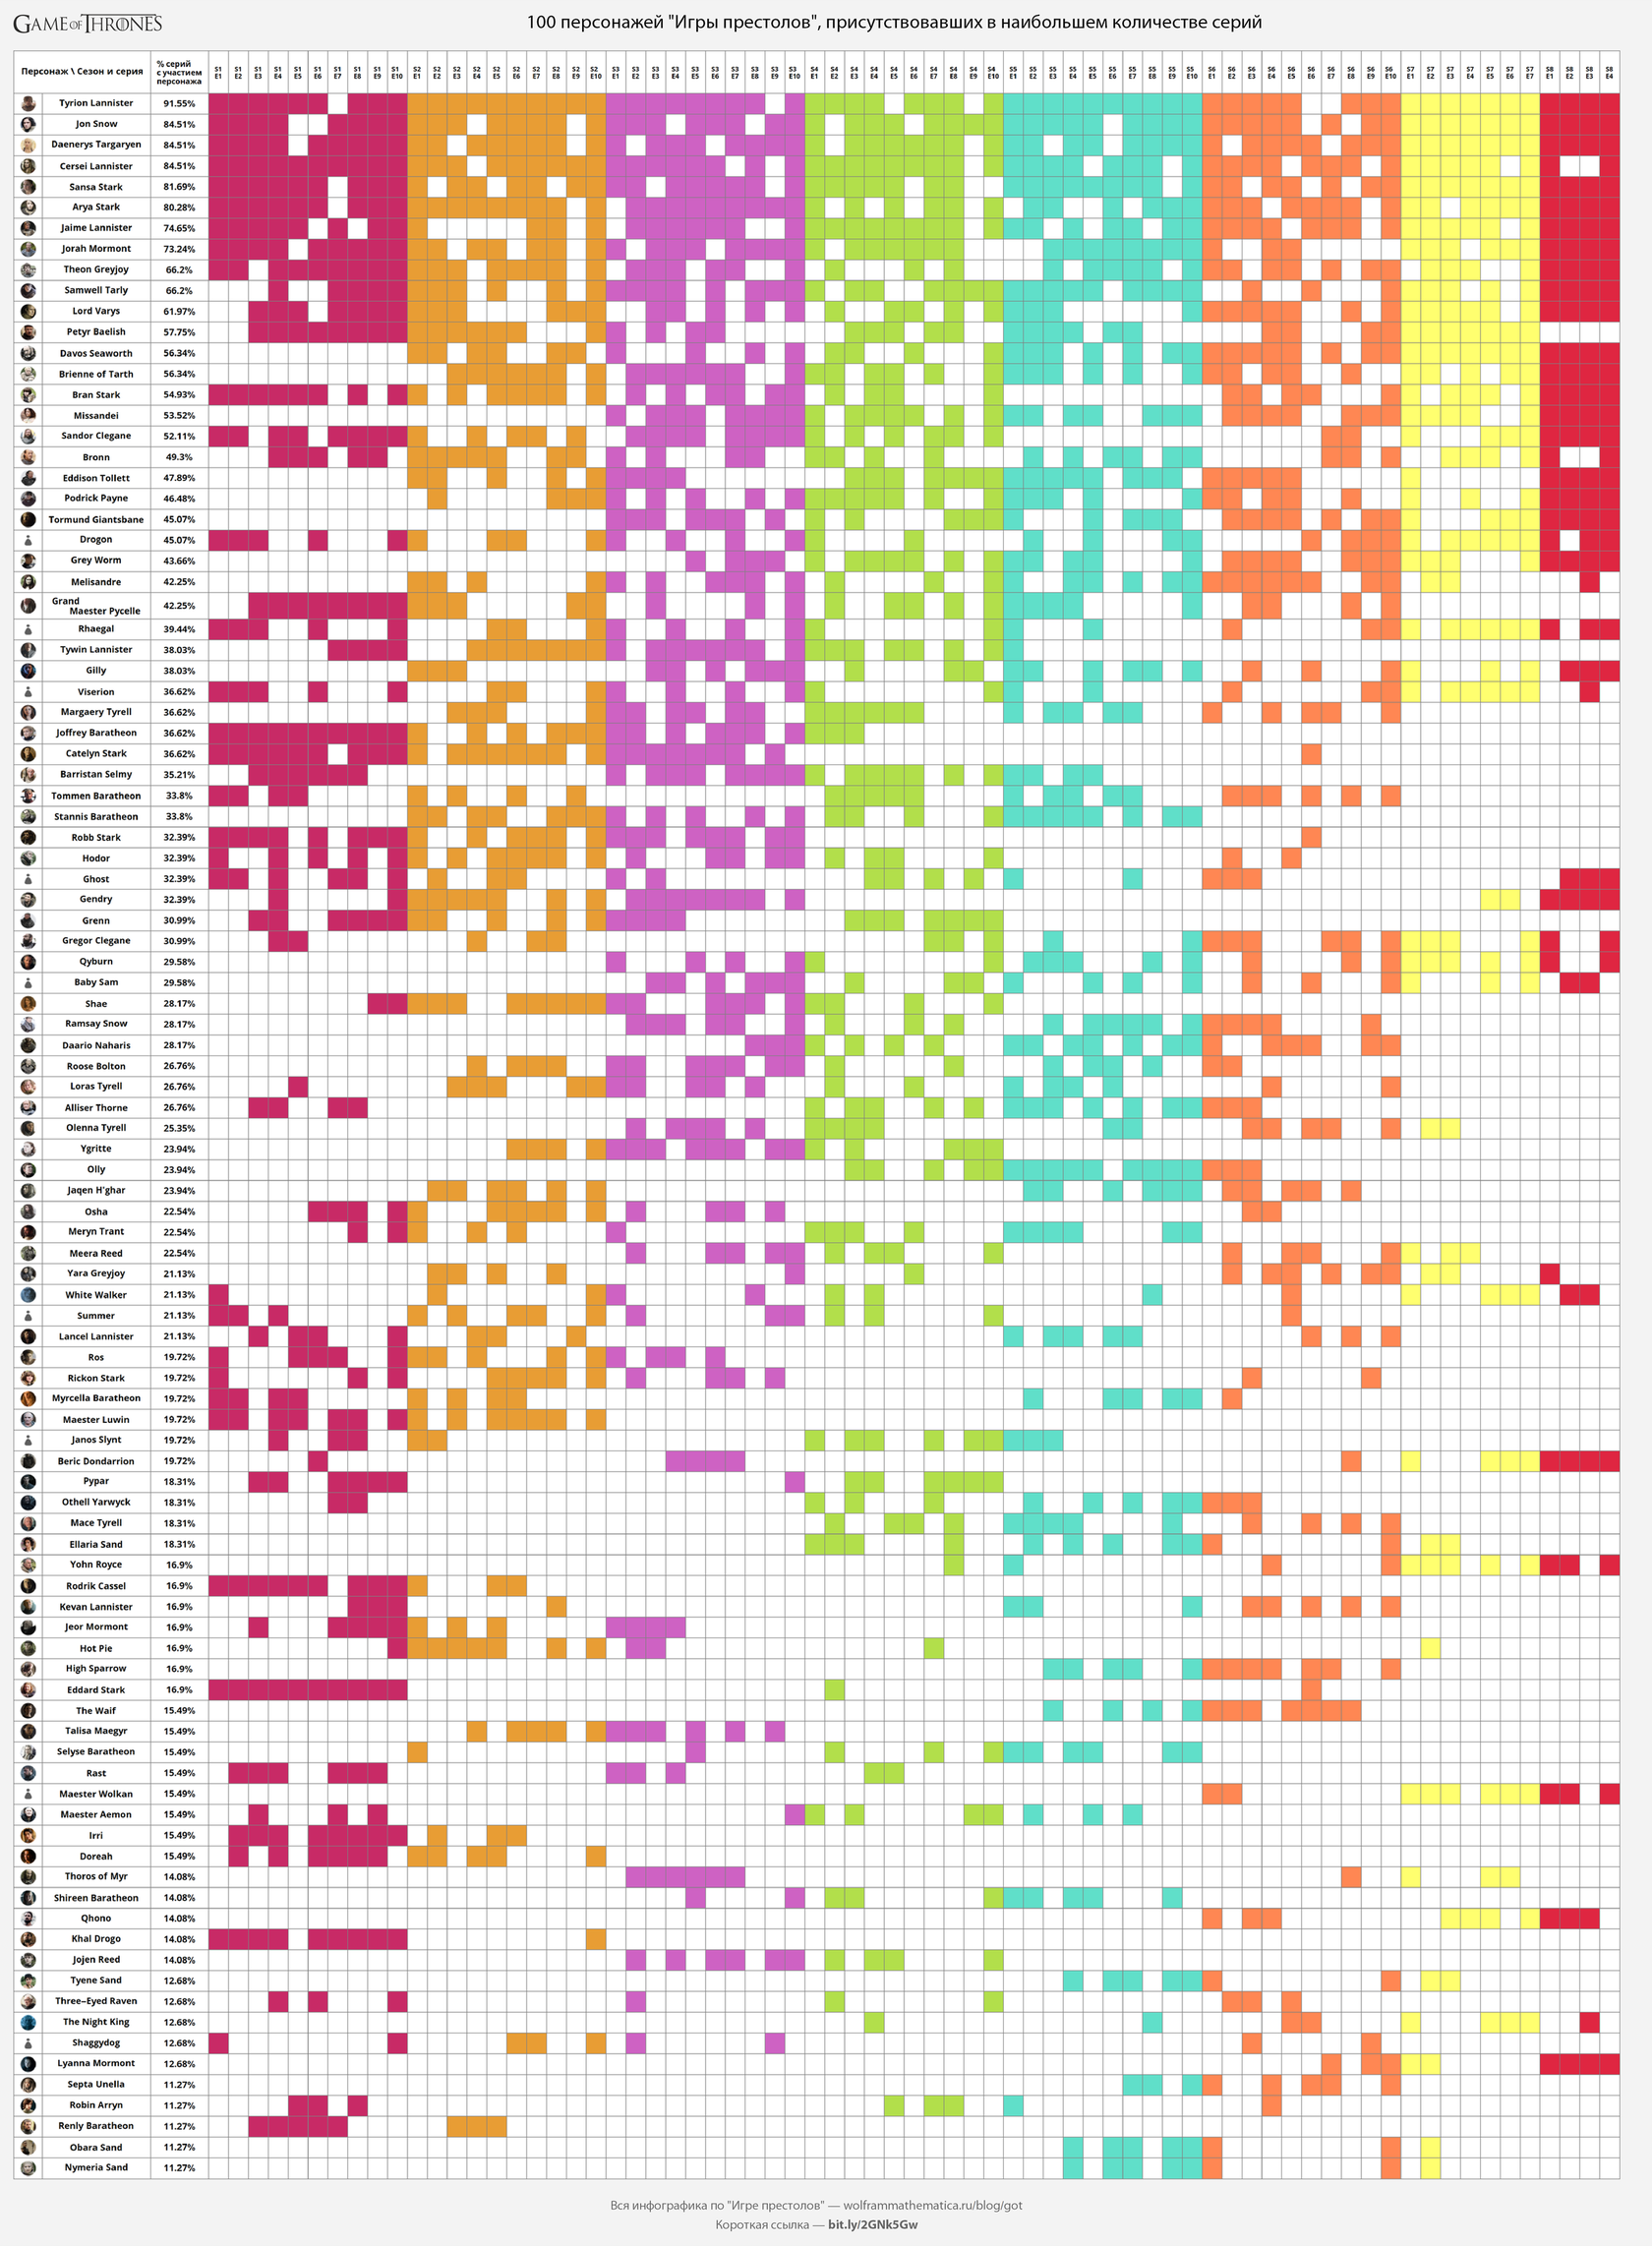
Qual dos personagens estava no maior número de episódios de Game of Thrones?
Uma lista de personagens de Game of Thrones, classificados pelo número de episódios em que eles se conheceram:
$GOTCharacters= DeleteCases[ Reverse[ SortBy[ Tally[ Flatten[Keys@$GOTEpisodeData[[All,"ScreenTime"]]] ], Last ] ][ [;;,1] ], "" ];
Número de episódios em uma temporada:
$GOTSeriesInSeason= <| KeyValueMap[#1->Length@#2&,GroupBy[$GOTEpisodeData[[;;,1]],First]]|>;
"Máscara" da temporada (símbolo oficial):
$GOTSeasonsMask=KeyValueMap[ConstantArray[#1,#2]&,$GOTSeriesInSeason];
GOTCharacterBySeason calcula em quais séries de temporadas o personagem de Game of Thrones estava envolvido:
GOTCharacterBySeason[name_]:= Module[{initialData,empty}, initialData= Map[ #[[;;,2]]&, GroupBy[ Cases[ {#[[1]],Keys[#[[2]]]}&/@ Lookup[ $GOTEpisodeData, {"EpisodeN","ScreenTime"} ], {number_,episode_/;Not[FreeQ[episode,name]]}:> number ], First ] ]; empty=Complement[Range[1,8],Keys[initialData]]; If[ Length[empty]===0, initialData, (* else *) KeySort@<|initialData,<|#->{}&/@empty|>|> ] ]
GOTCharacterBySeasonPlot visualiza os dados recebidos por
GOTCharacterBySeason .
GOTCharacterBySeasonPlot[name_]:= Flatten@ KeyValueMap[ ReplacePart[ $GOTSeasonsMask[[#1]], Thread[ Complement[Range[1,$GOTSeriesInSeason[#1]],#2]->0 ] ]&, GOTCharacterBySeason[name] ]
Conjunto de cores
$ GOTSeasonColors , para exibir visualmente um conjunto de séries da temporada.
$GOTSeasonColors= {0->White} ~ Join ~ Thread[Range[1,8]->ColorData[54,"ColorList"][[1;;8]]];
Por fim, construiremos uma tabela na qual seja claramente visível qual dos personagens em que série de “Game of Thrones” estava e em que não estava)
GOTInfographicsPoster[ #, "100 \" \", ", "ImageSize"->2500 ]&@ Grid[ { { " \\ ", SpanFromLeft, Style["% \n \n",12] } ~ Join ~ Map[ Style[ "S"<>ToString[#[[1]]]<>"\nE"<>ToString[#[[2]]],10 ]&, Keys[$GOTEpisodeN] ] } ~ Join ~ ( ( { ImageResize[#/.$characterImage,{Automatic,25}], #, PercentForm[ N@Total[Length/@GOTCharacterBySeason[#]] / Last[$GOTEpisodeN] ] } ~ Join ~ ReplaceAll[ GOTCharacterBySeasonPlot[#], x_Integer:>Item["",Background->x/.$GOTSeasonColors] ]&/@ DeleteCases[ $GOTCharacters[[1;;100]],"" ] ) ), ItemSize->{{2,10,5,{1.2}},{4,{1}}}, Background->White, Dividers->Gray, ItemStyle -> Directive[ FontFamily->"Open Sans",14,Bold,LineSpacing->{0.8,0,0} ], Alignment->{Center,Center} ]
(
original )
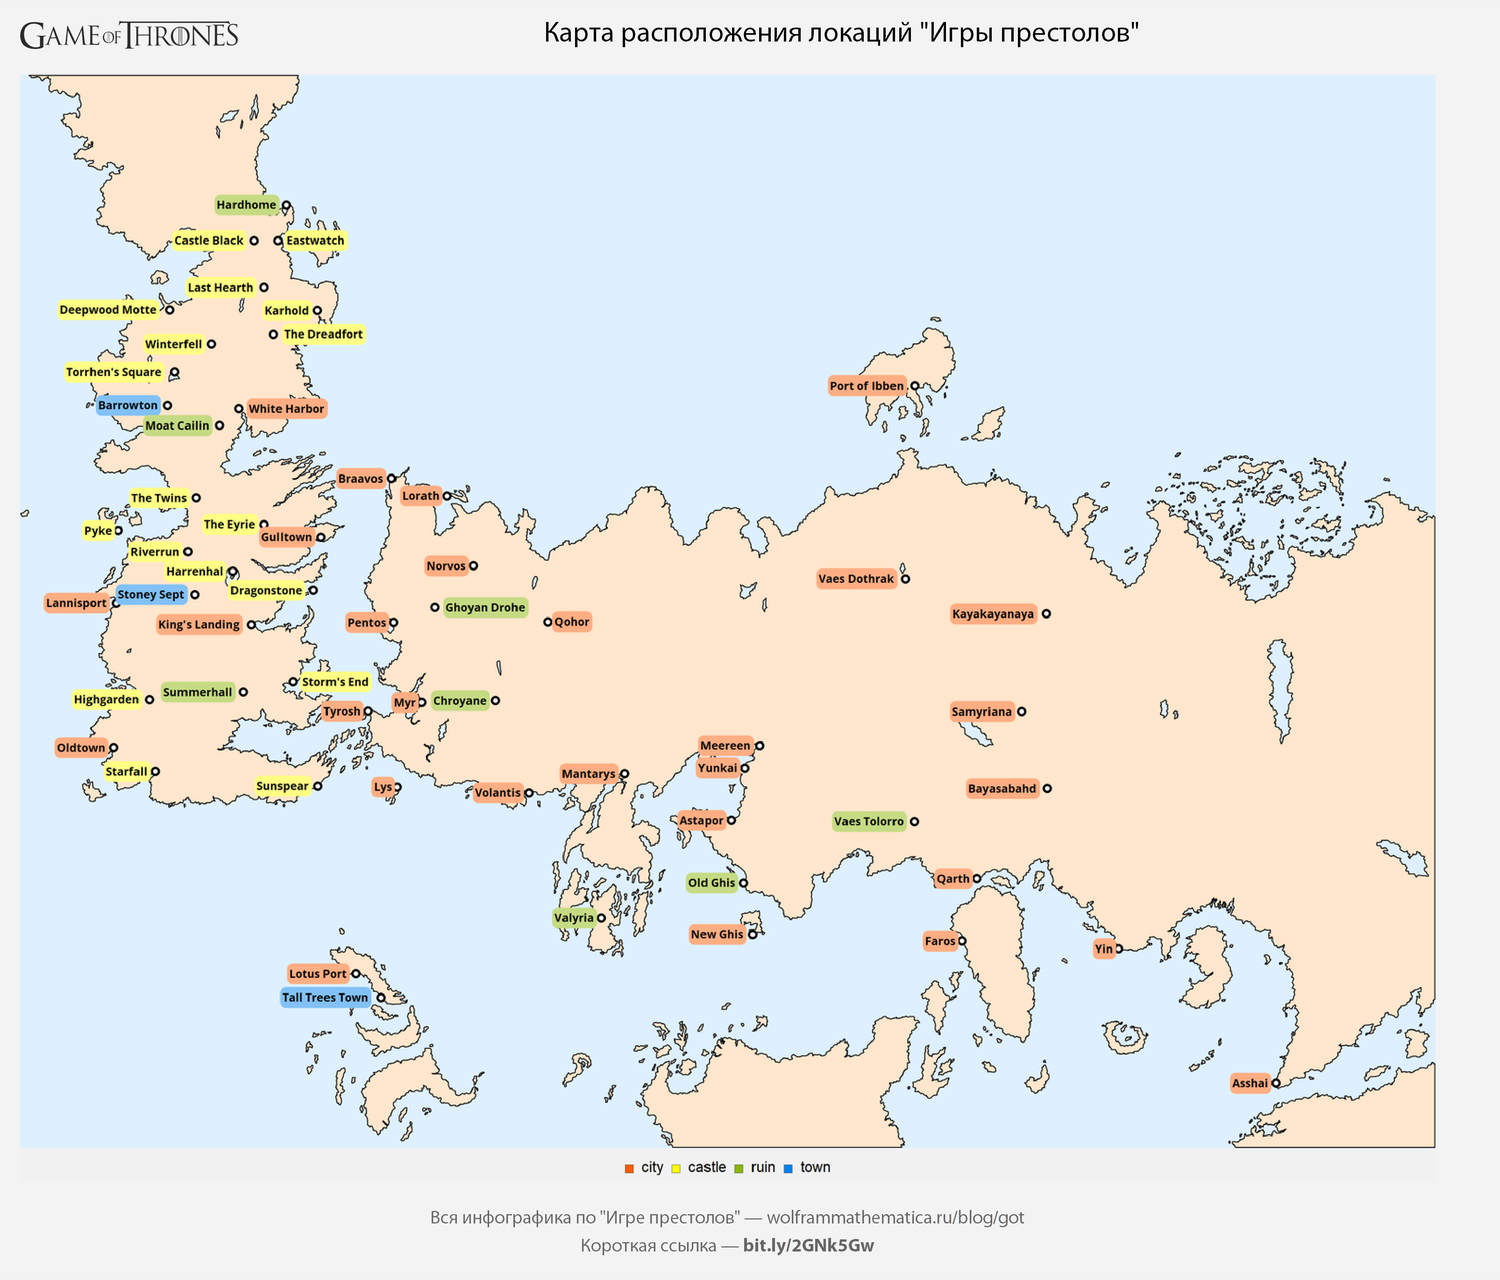
Os locais mais populares "Game of Thrones"
Mapa de locais "Game of Thrones"
Construímos um mapa a partir de primitivas geométricas. Vamos criar o conjunto deles:
index=1; $GOTLakesIDs= { 11, 8, 9, 10, 2, 529, 530, 522, 523, 533, 532, 526, 521, 525, 531, 524, 528, 527, 7, 3, 4, 5, 6 };
$GOTMapPolygons= { FaceForm@If[MemberQ[$GOTLakesIDs,index],LightBlue,LightOrange], EdgeForm[AbsoluteThickness[1]], index++;Polygon[Accumulate[#]] }&/@ GOTRawData["lands-of-ice-and-fire.json"]["arcs"];
Crie um conjunto de lugares no mapa de Game of Thrones:
$GOTMapPlaces= Lookup[ GOTRawData["lands-of-ice-and-fire.json"]["objects"]["places"][ "geometries" ], {"coordinates","properties"} ];
$GOTMapPlaceCoordinates=Map[#[[2,"name"]]->#[[1]]&,$GOTMapPlaces];
A função
GOTMap é usada para criar todos os tipos de lugares e trajetórias "geográficas" no mapa "Game of Thrones":
GOTMap[additinals_,OptionsPattern[{"ImageSize"->1500}]]:= Legended[ Graphics[ { $GOTMapPolygons, ( { { AbsolutePointSize[10], Black, Point[#1[[1]]], AbsolutePointSize[5], White, Point[#1[[1]]] }, Inset[ With[{placeType=#1[[2]]["type"]}, ( Framed[ #1, Background -> ( placeType /. Thread[ { "city", "castle", "ruin", "town" } -> ( Lighter[ RGBColor[ #1/255 ], 0.5 ]& )/@ { {254,92,7}, {254,252,9}, {138,182,7}, {2,130,237} } ] ), RoundingRadius->6, FrameStyle->None, FrameMargins->2 ]& )[ Style[ #1[[2]]["name"], LineSpacing->{0.8,0,0}, FontFamily->"Open Sans", Bold, 12 ] ] ], #1[[1]], If[ MemberQ[ { "Eastwatch", "The Dreadfort", "White Harbor", "Storm's End", "Ghoyan Drohe", "Qohor" }, #1[[2]]["name"] ], Scaled[{-0.1,1/2}], (* else *) Scaled[{1.1,1/2}] ] ] }& )/@ $GOTMapPlaces, additinals }, ImageSize->OptionValue["ImageSize"], Background->LightBlue, PlotRangePadding->0 ], (Placed[#1,"Bottom"]&)[ SwatchLegend[ (RGBColor[#1/255]&)/@ {{254,92,7},{254,252,9},{138,182,7},{2,130,237}}, {"city","castle","ruin","town"}, LegendLayout->"Row" ] ] ]
Crie o próprio mapa:
GOTInfographicsPoster[ #," \" \"","ImageSize"->1500 ]&@ GOTMap[{}]
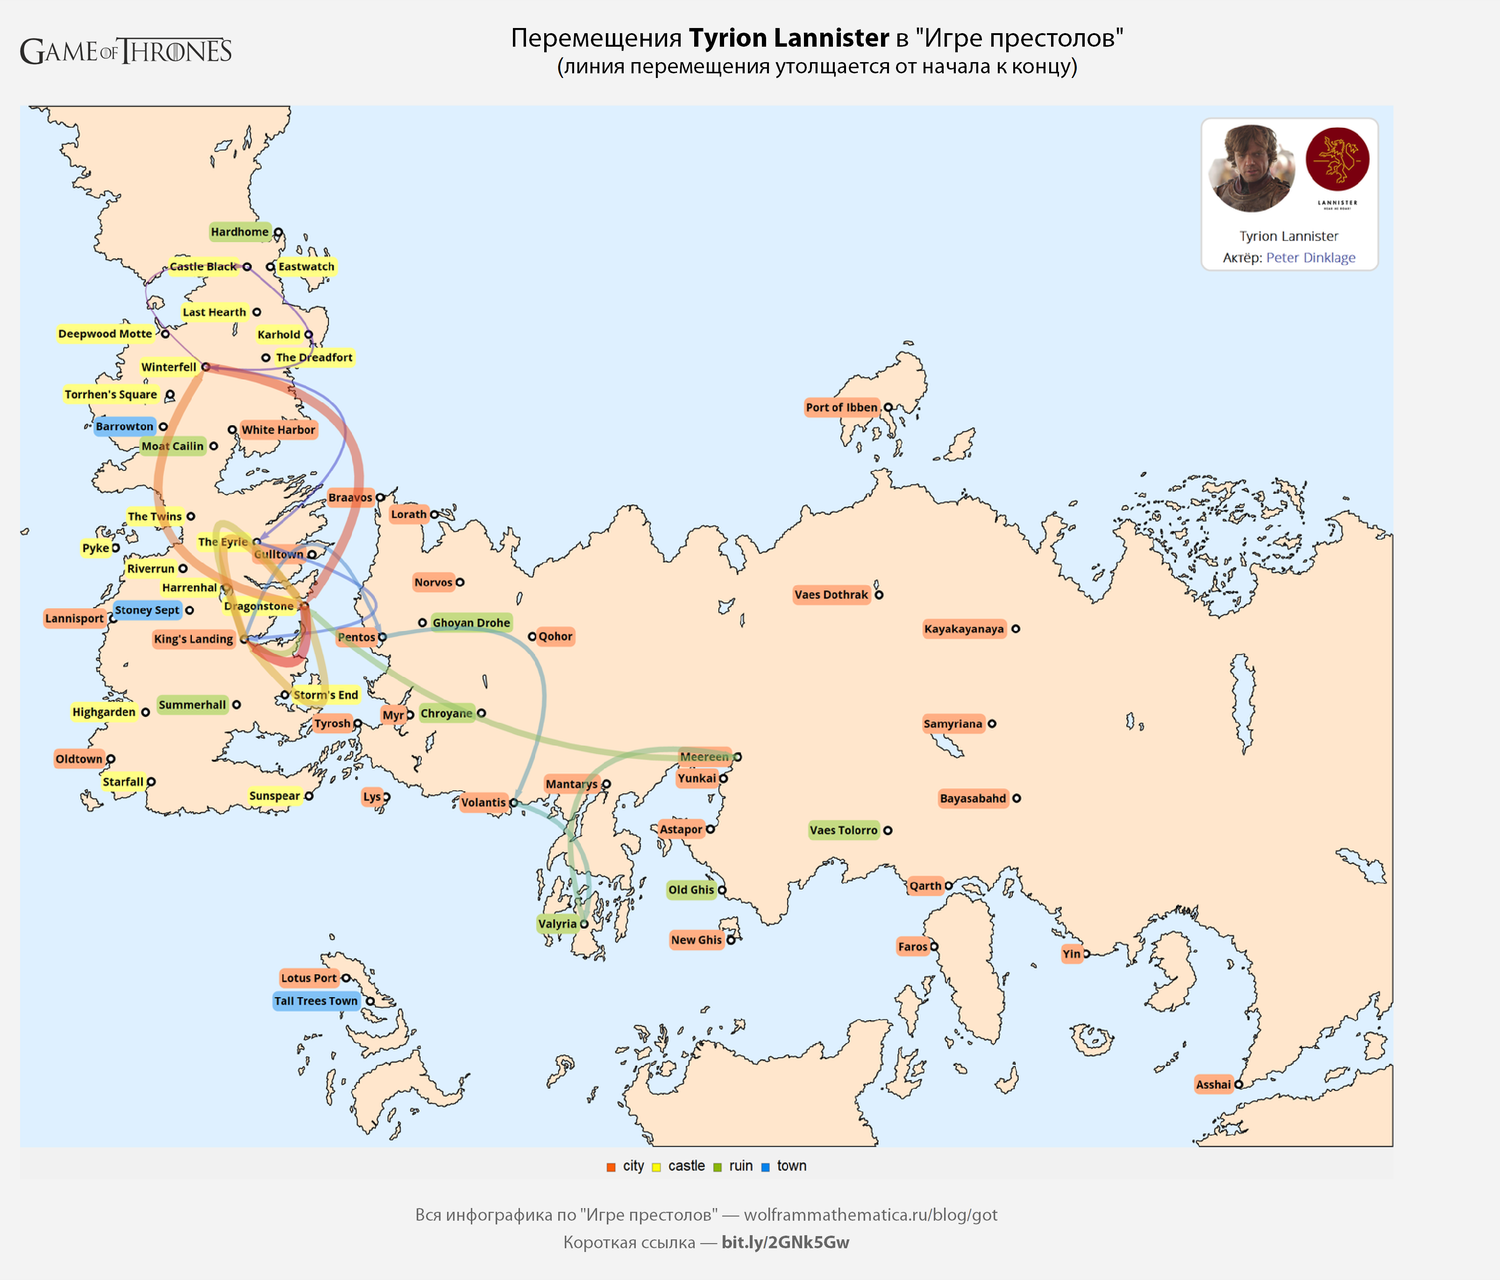
Movendo personagens de Game of Thrones de série em série
A função
GOTCharacterLocationNamesSequence calcula os movimentos do personagem entre os locais de Game of Thrones:
GOTCharacterLocationNamesSequence[name_]:= Merge[$GOTEpisodeData[[;;,"CharacterLocations"]],Identity][name];
A função
GOTCharacterLocationSequence converte os nomes dos lugares em suas coordenadas "geográficas":
GOTCharacterLocationSequence[name_]:= DeleteCases[ Partition[ Flatten[ DeleteCases[ GOTCharacterLocationNamesSequence[name] /. {{x_String,y_String}:>y,{x_String}:>x} /. $GOTMapPlaceCoordinates, _String, Infinity ], 1 ], 2, 1 ], {x_,x_} ];
A função
GOTMapTraectory cria uma trajetória no mapa de Game of Thrones:
ClearAll[GOTMapTraectory]; GOTMapTraectory[path_,colorFunction_:ColorData["Rainbow"]]:= Module[{kol}, kol=Length[path]; Table[ { Opacity[0.5], colorFunction[(i-1)/(kol-1)], AbsoluteThickness[10i/kol+1], CapForm["Round"], Arrow[ BSplineCurve[ { path[[i,1]], Mean[path[[i]]] + RandomInteger[{5000,20000}] Function[#/Norm[#]][ RandomChoice[{1,1}] {-1,1} * Reverse[path[[i,2]]-path[[i,1]]] ], path[[i,2]] } ] ] }, {i,1,kol} ] ];
Finalmente, podemos construir um mapa do movimento de qualquer personagem do Game of Thrones. Construa-os para os 10 heróis mais populares.
( Print[ With[{track=#1,name=#1[[1]]}, ( GOTInfographicsPoster[ #1, Row[ { " ", Style[name,Bold], " \" \"", "\n", Style[ "( )", 25 ] } ], "ImageSize"->1500 ]& )[ GOTMap[ { Arrowheads[{0,0.01}], ( With[{color=#1[[2]]}, GOTMapTraectory[ GOTCharacterLocationSequence[name] ] ]& )[ track ], Inset[ track[[1]]/.$characterCardFull, Scaled[{0.99,0.99}], Scaled[{1,1}] ] } ] ] ] ]& )/@ ({#1,RGBColor[{200,42,102}/255]}&)/@$GOTCharacters[[1;;10]];

(outros cartões veja
aqui )
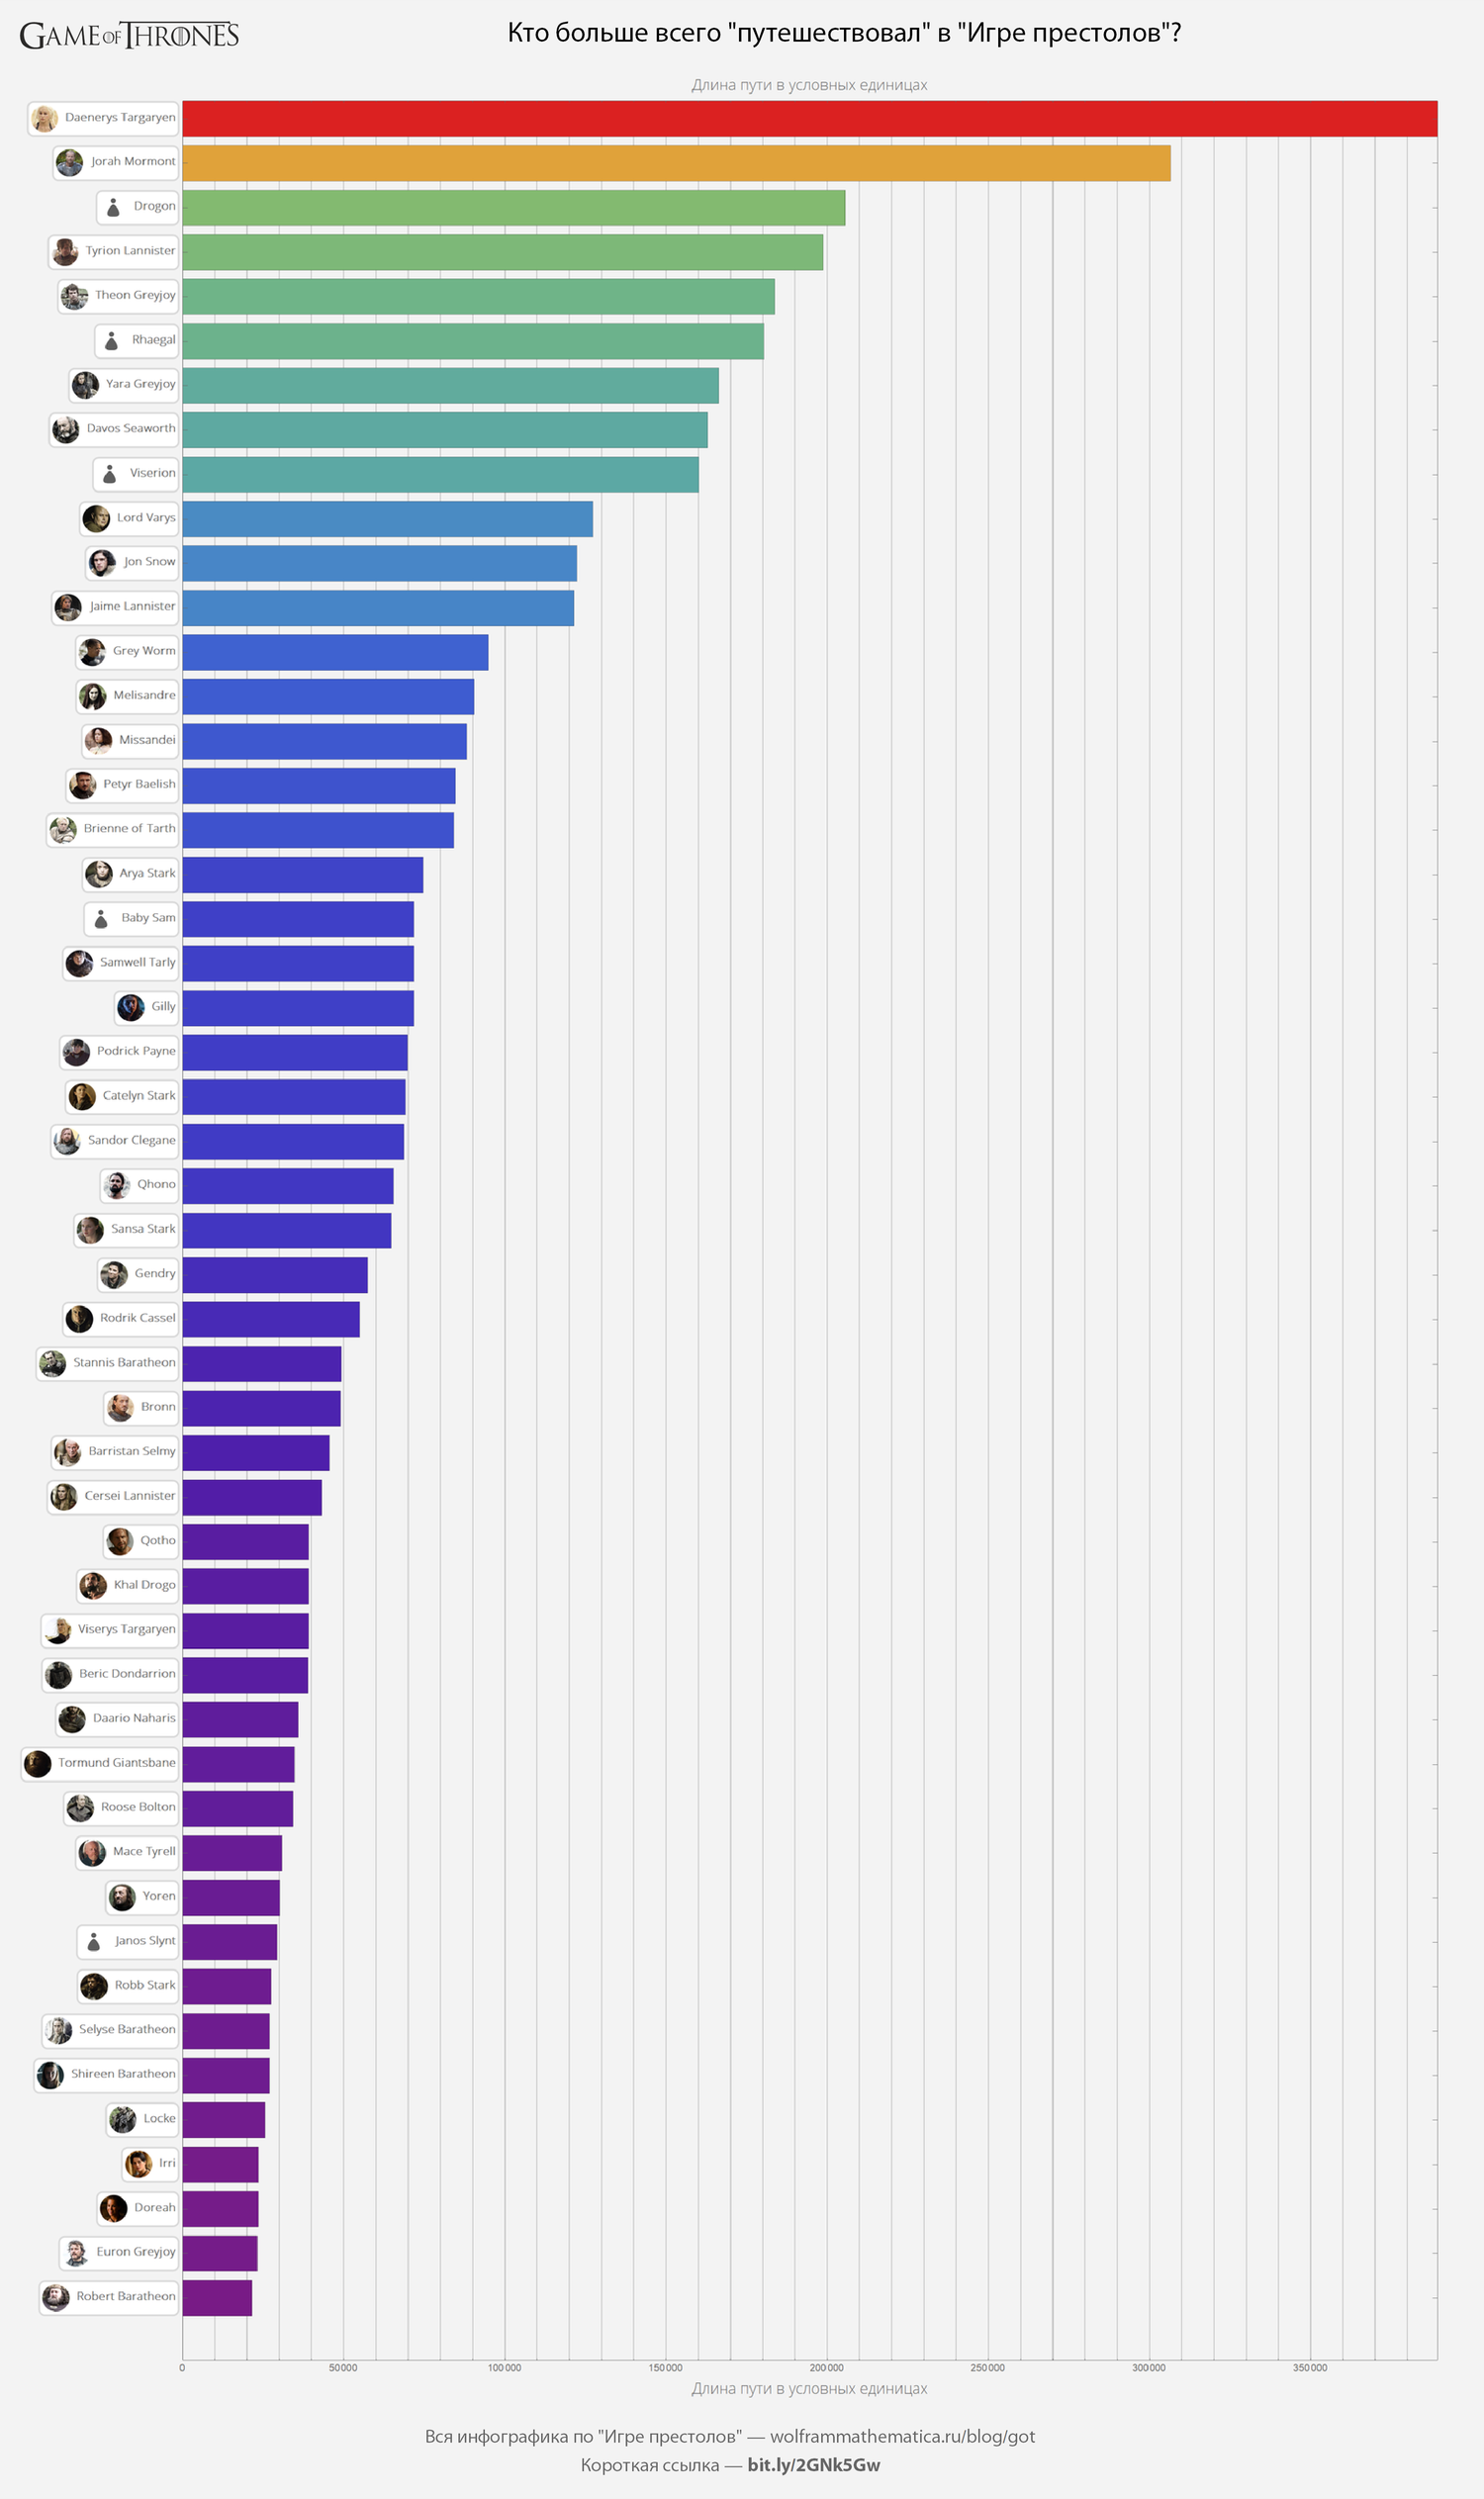
Quem é o mais "viajado" dos personagens de "Game of Thrones"?
Vamos encontrar a extensão do caminho percorrido por cada personagem do Game of Thrones em unidades arbitrárias e ver quem mais viajou, de acordo com Westeros:
GOTInfographicsPoster[ #1, " \"\" \" \"?", "ImageSize"->1500 ]&@ ( ( BarChart[ #1[[1;;All,1]], PlotRangePadding->0, BarSpacing->0.25, BarOrigin->Left, AspectRatio->1.8, ImageSize->1500, ChartLabels->#1[[1;;All,2]], Frame->True, GridLines->{Range[0,10^6,10^4],None}, ColorFunction->ColorData["Rainbow"], FrameLabel-> { {None,None}, Style[#,FontFamily->"Open Sans Light",16]&/@ { " ", " " } }, Background->GrayLevel[0.95] ]& )[ Cases[ SortBy[ ( { Total[ (Norm[Subtract@@#1]&)/@ GOTCharacterLocationSequence[#1] ], #1/.$characterCardShortSmall }& )/@ DeleteCases[ $GOTCharacters, Alternatives@@ { "", "Musician #1", "Musician #2", "Musician #3" } ], First[#1]& ], {x_/;x>0,_} ][ [-50;;-1] ] ] )
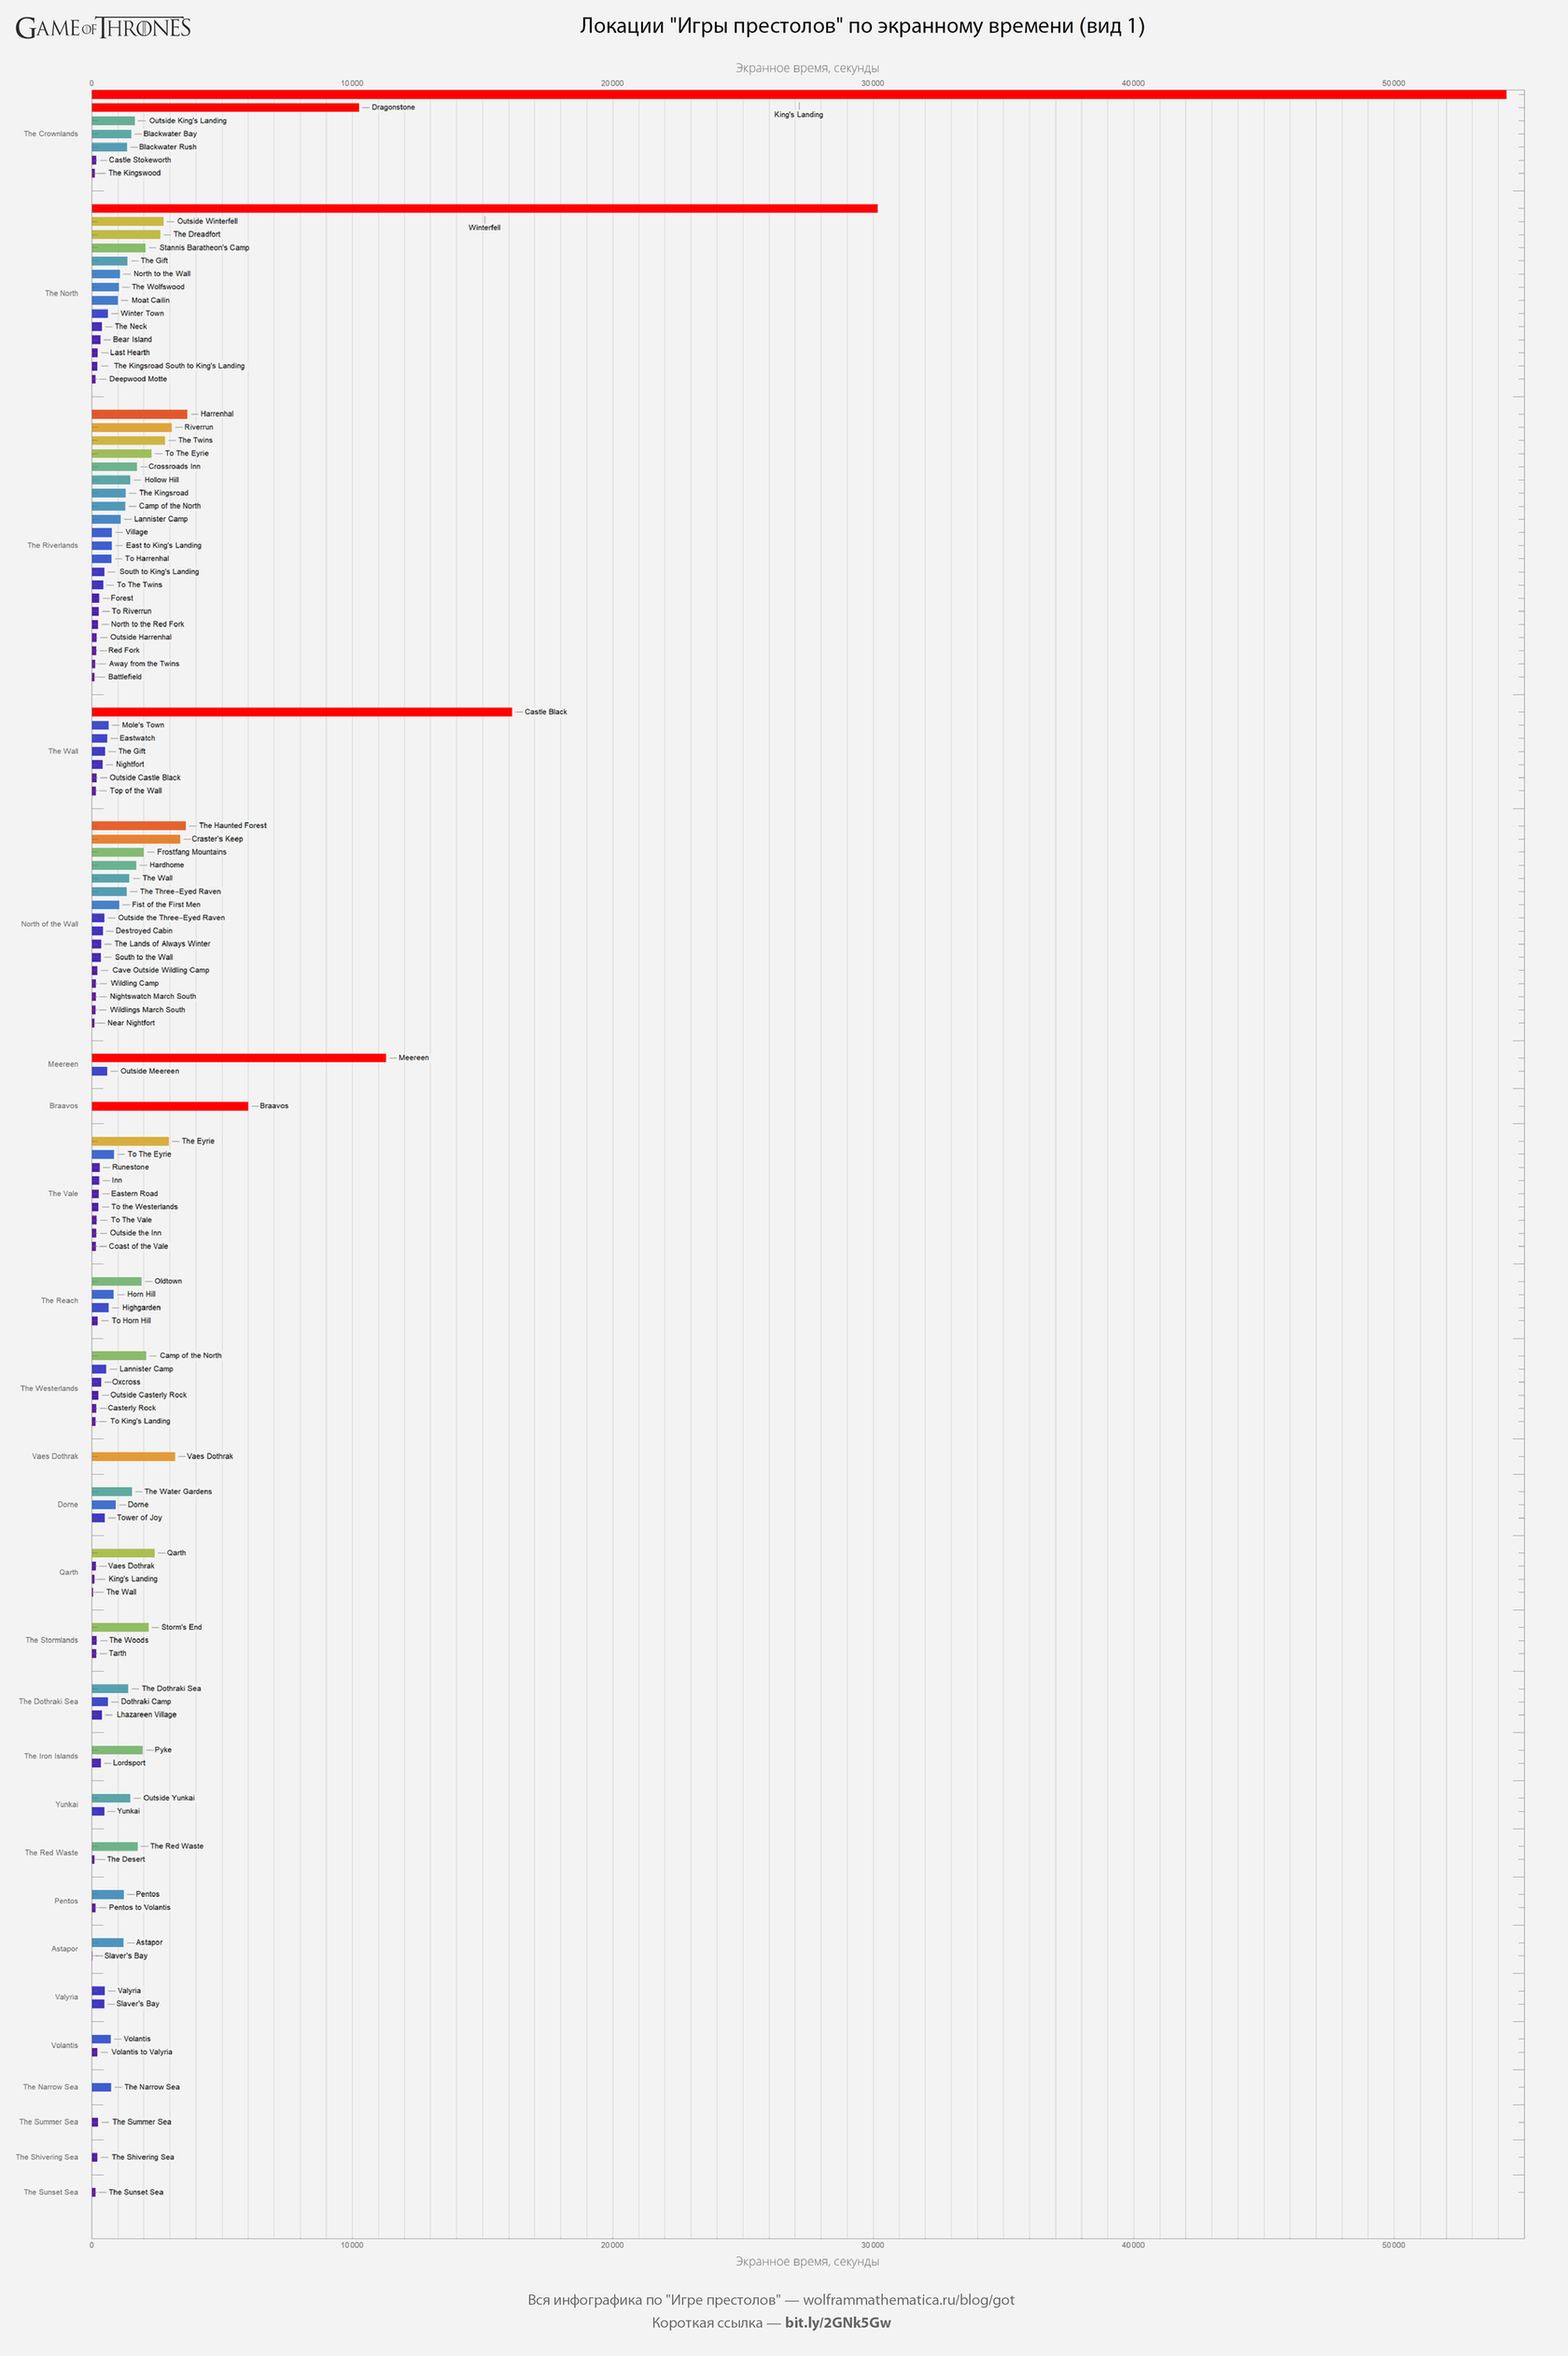
Os locais mais populares "Game of Thrones" (na tela)
Calculamos para cada local (e região) no mapa de Game of Thrones o tempo total da tela e exibimos o resultado de várias formas. Você verá imediatamente os locais mais populares.
Dados na forma de um gráfico de barras:
GOTInfographicsPoster[ #1, " \" \" ( 1)", "ImageSize"->2000 ]&@ ( BarChart[ #[[;;,1]], PlotRangePadding->0, BarSpacing->{0.5,3}, BarOrigin->Left, AspectRatio->1.5, ImageSize->2000, ChartLabels->{#[[;;,2]],None}, ColorFunction-> Function[ {x},If[x>4000,Red,ColorData["Rainbow"][x/4000]] ], ColorFunctionScaling->False, PlotRange->{0,55000}, Frame->True, GridLines->{Range[0,60000,1000],None}, GridLinesStyle->LightGray, FrameTicks->{All,Automatic}, FrameLabel-> { {None,None}, Style[#,FontFamily->"Open Sans Light",16]&/@ { " , ", " , " } }, Background->GrayLevel[0.95] ]&@ KeyValueMap[ { Callout[ #[[1]], #[[2]], If[#[[1]]>20000,Bottom,Right], If[#[[1]]>4000,Scaled[1/2],Automatic] ]&/@ Transpose[{#2[[;;,2]],#2[[;;,1]]}], #1 }&, SortBy[ GroupBy[ KeyValueMap[ {#1,#2}&, Merge[ $GOTEpisodeData[[All,"LocationTime"]], Total[Flatten[#]]& ] ], #[[1,1]]&, SortBy[ Transpose[ { #[[;;,1]] /. { {x_String,y_String}:>y, {x_String}:>x }, #[[;;,2]] } ] /. {"",_}:>Nothing, Last[#]& ]& ], Total[#[[;;,2]]]& ] ] )
(
original )
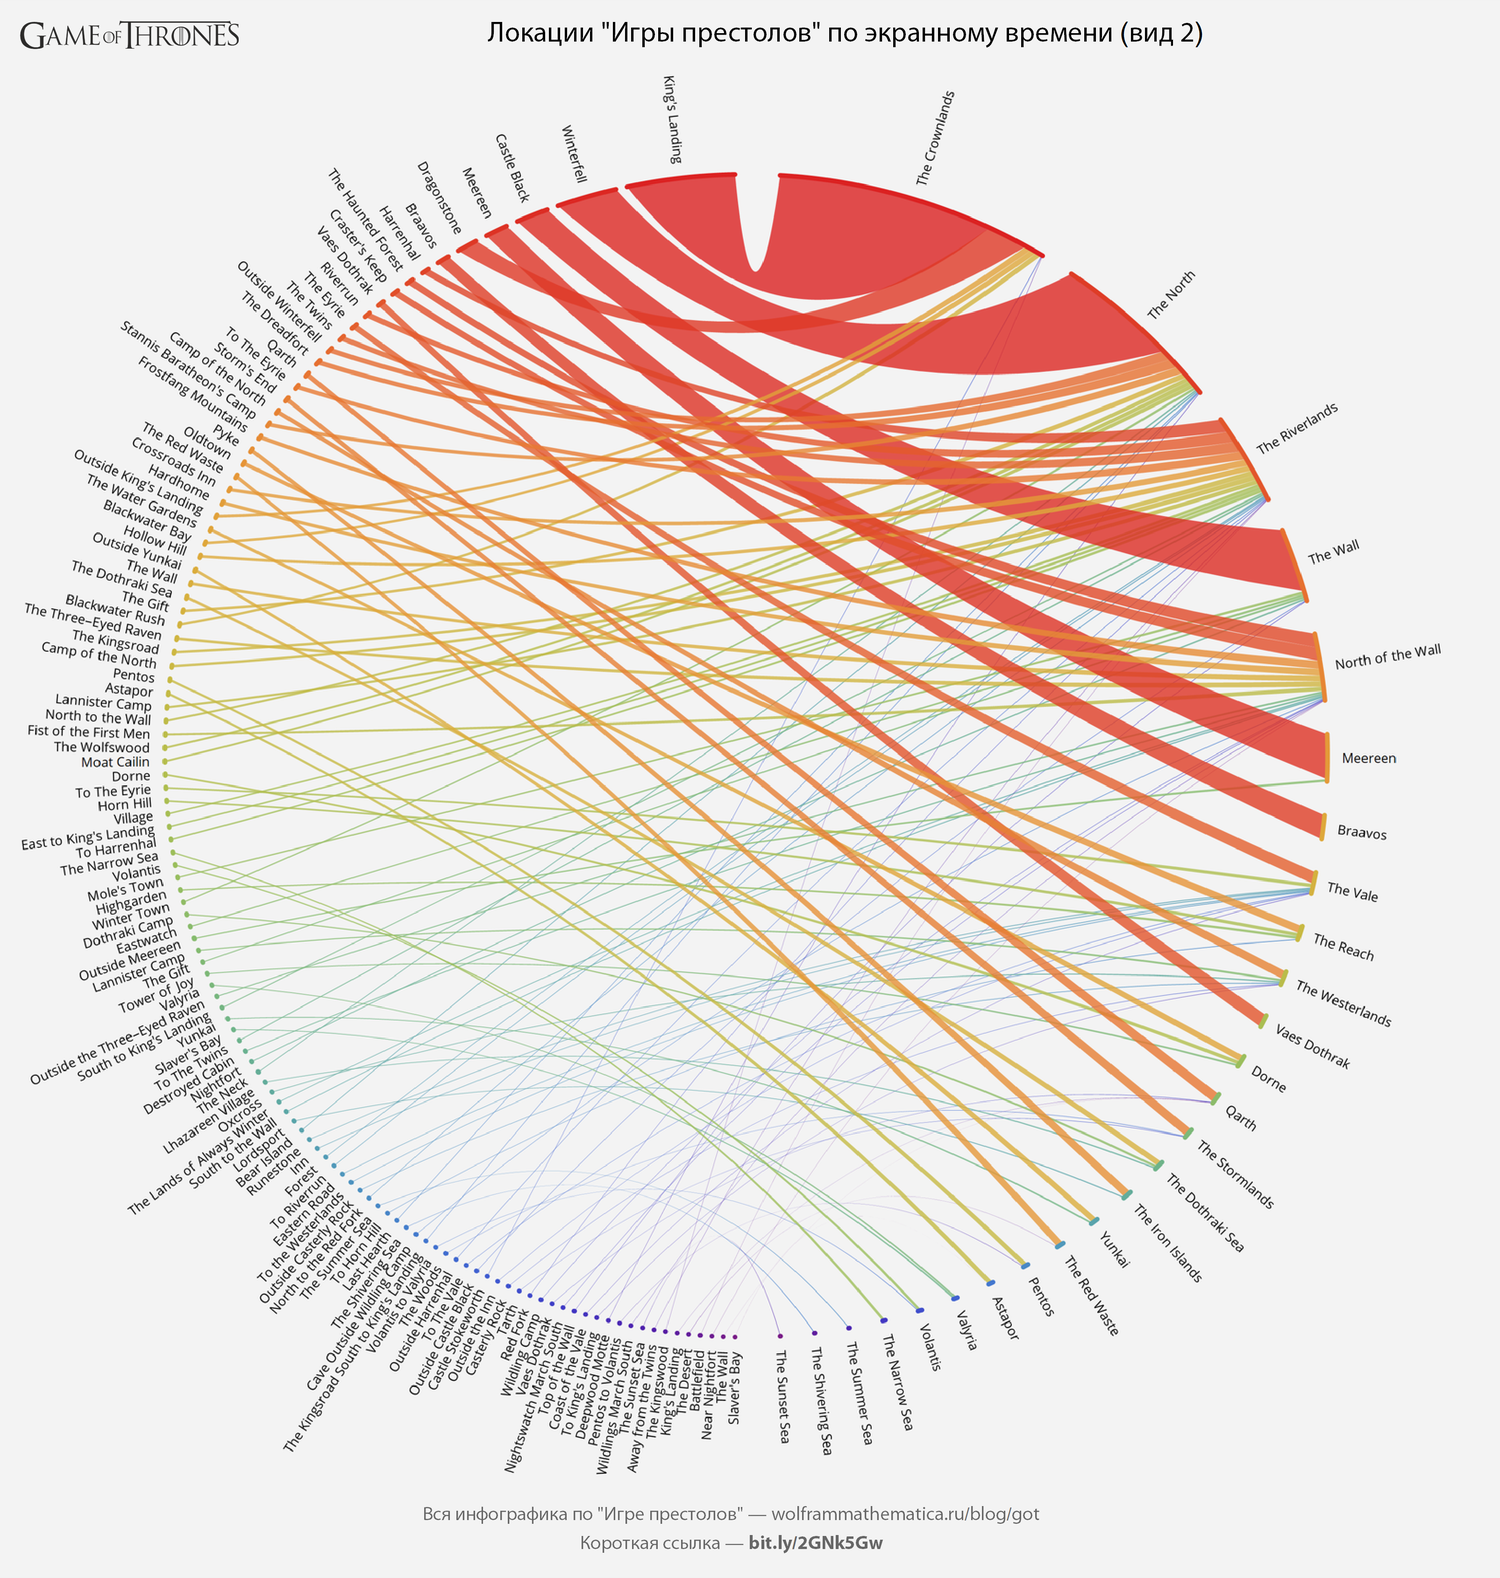
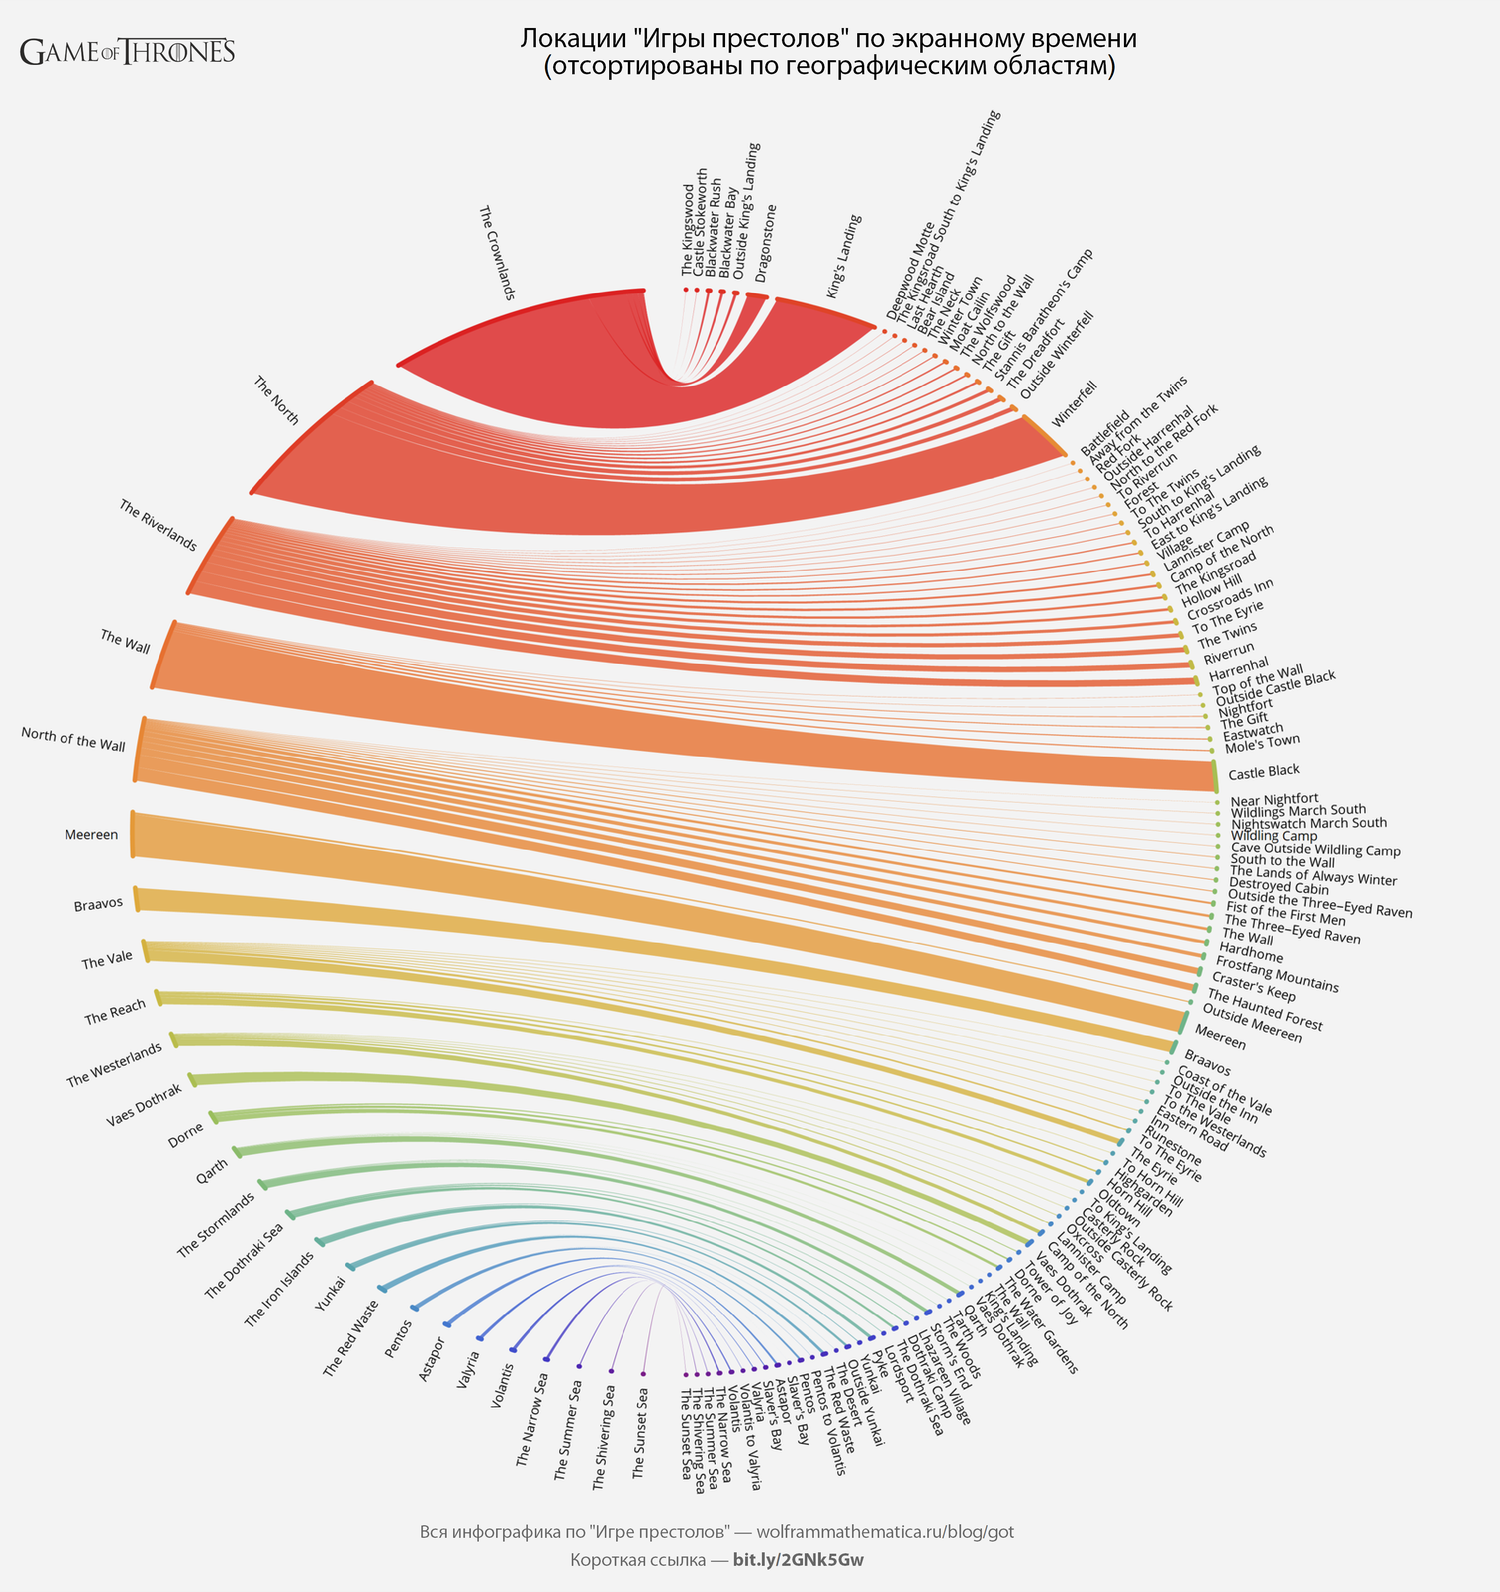
Dados na forma de um gráfico de pizza:
{ Print[ GOTInfographicsPoster[ #1, " \" \" ( 2)", "ImageSize"->1500 ]&@ stripLineInfographics[ #, "Reverse"->False, "Gaps"->{75,50}, "ColorFunctionRight"->ColorData["Rainbow"] ] ], Print[ GOTInfographicsPoster[ #1, " \" \" \n( )", "ImageSize"->1500 ]&@ stripLineInfographics[ #, "Reverse"->True, "Gaps"->{50,75}, "ColorFunctionRight"->ColorData["Rainbow"] ] ] }&@ SortBy[ GroupBy[ KeyValueMap[ {#1,#2}&, Merge[ $GOTEpisodeData[[All,"LocationTime"]], Total[Flatten[#]]& ] ], #[[1,1]]&, SortBy[ Transpose[ { #[[;;,1]] /. {{x_String,y_String}:>y,{x_String}:>x}, #[[;;,2]] } ] /. {"",_}:>Nothing, Last[#]& ]& ], -Total[#[[;;,2]]]& ];
(
original )
(
original )
Quais filmes os atores de Game of Thrones jogaram e quão familiarizados eles são?
Claro, os atores de Game of Thrones ainda jogaram muito. Calculamos e
inserimos na variável
$ GOTCharactersInAnotherFilms os dados sobre quais filmes quais dos atores interpretaram.
$GOTCharactersInAnotherFilms= SortBy[ Map[ { #[[1]], #[[2]][[;;,"characterName"]], If[ Head[#[[3]]]===Missing, 0, (* else *) StringCases[#[[3]],DigitCharacter..] /. x_/;Length[x]>0:>ToExpression[x] ] /. {{x_}:>x,{}->0} }&, Lookup[ Values[GOTRawData["costars.json"]], {"title","actors","year"} ] ], -Length[#[[2]]]& ];
Agora vamos calcular para cada ator em que filme ele atuou e colocar o resultado na variável
$ GOTCharactersFilmography .
$GOTCharactersFilmography= Association@ SortBy[ Select[ #-> SortBy[ Cases[ $GOTCharactersInAnotherFilms, {film_,list_/;MemberQ[list,#],year_}:> {film,year} ], -Last[#]& ]&/@ $GOTCharacters, Length[#[[2]]]>0& ], -Length[#[[2]]]& ];
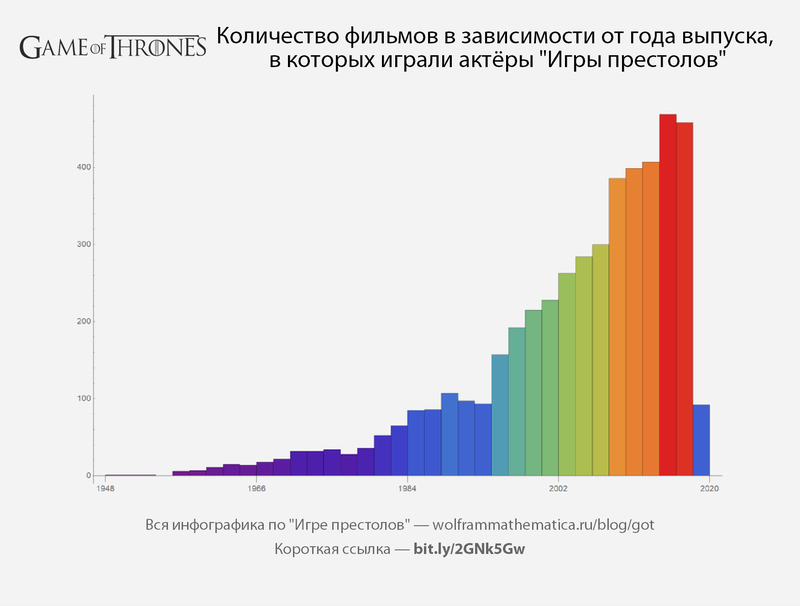
Vamos descobrir nos filmes em que anos de lançamento os atores de "Game of Thrones" interpretaram:
GOTInfographicsPoster[ #1, " , \" \"", "ImageSize"->800 ]&@ DateHistogram[ DeleteMissing@ Lookup[Values[GOTRawData["costars.json"]],"year"], ColorFunction->"Rainbow", ImageSize->800, Background->GrayLevel[0.95] ]
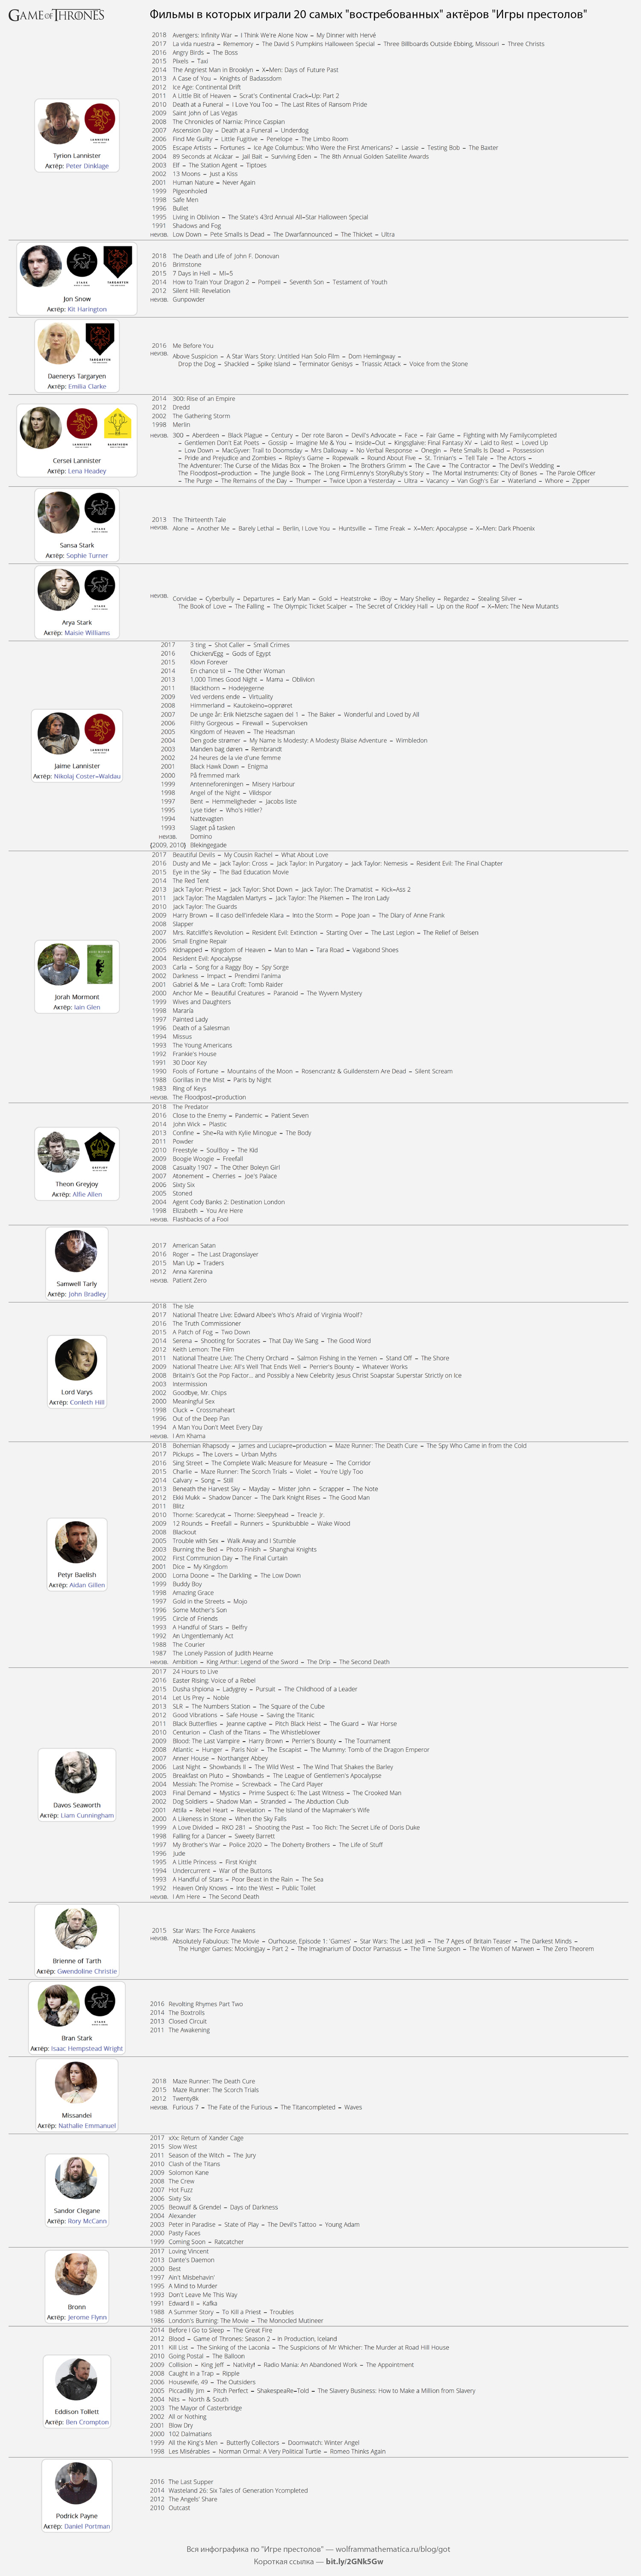
Filmes em que os atores mais populares de Game of Thrones atuaram:
GOTInfographicsPoster[ #1, " 20 \"\" \" \"", "ImageSize"->1500 ]&@ Grid[ { #/.$characterCardFull, TextCell[ Grid[ KeyValueMap[ {#1/.{0->"."},Row[#2," - "]}&, GroupBy[#,Last,#[[;;,1]]&] ], Alignment->{{Center,Left},{Top,Top}} ], FontFamily->"Open Sans Light", FontSize->14, TextAlignment->Left, LineSpacing->{0.9,0,0} ]&@ $GOTCharactersFilmography[#] }&/@ $GOTCharacters[[1;;20]], Alignment->{{Center,Left},Center}, ItemSize->{{20,70},Automatic}, Background->GrayLevel[0.95], Dividers->{None,{None,{Gray},None}} ]
(
original )
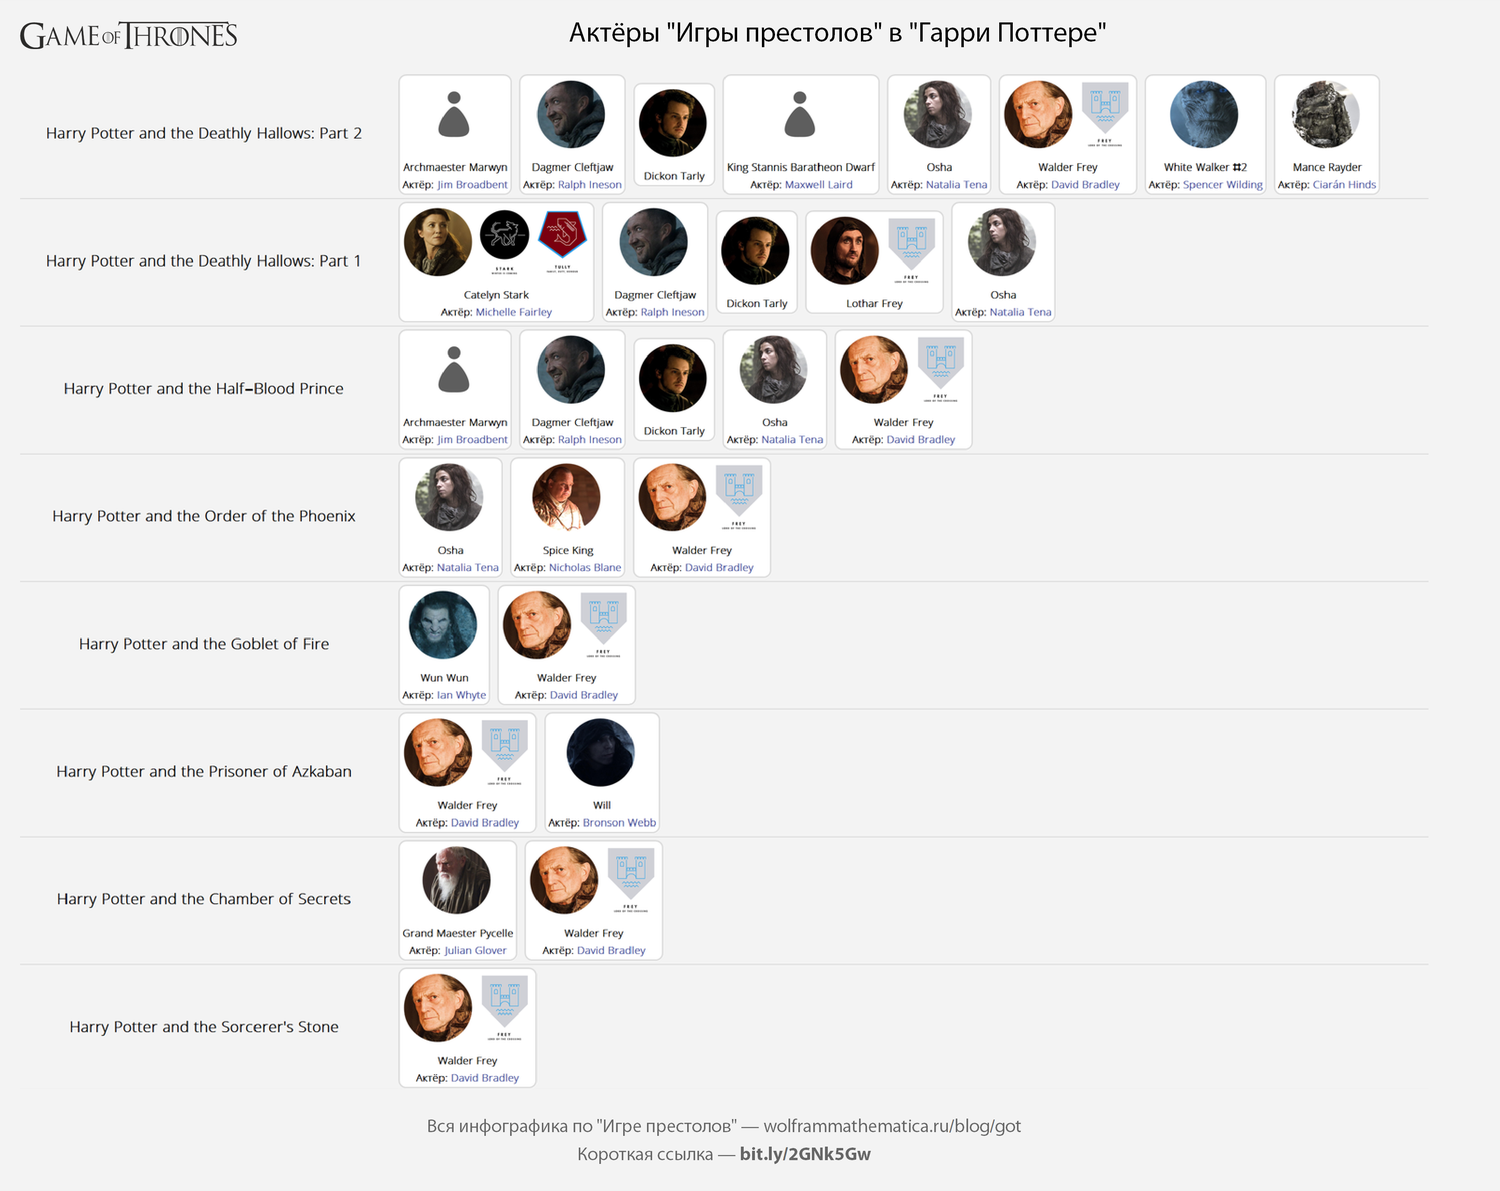
Atores de Game of Thrones em Harry Potter
GOTInfographicsPoster[ #," \" \" \" \"","ImageSize"->1500 ]&@ Grid[ { Style[#[[1]],FontFamily->"Open Sans Light",16,Bold], Row[Magnify[#,0.75]&/@(#[[2]]/.$characterCardFull)," "] }&/@ SortBy[ Select[ $GOTCharactersInAnotherFilms, StringMatchQ[ ToLowerCase@#[[1]],___~~"harry potter"~~___ ]& ], -Last[#]& ][ [{1,-1,2,3,4,5,6,7}] ], Background->GrayLevel[0.95], ItemSize->{{25,70},Automatic}, Dividers->{None,{None,{LightGray},None}}, Alignment->{{Center,Left},Center} ]
Atores do Game of Thrones em Guerra nas Estrelas
GOTInfographicsPoster[ #, " \" \" \" \"", "ImageSize"->1100 ]&@ Grid[ { Style[#[[1]],FontFamily->"Open Sans Light",16,Bold], Row[Magnify[#,0.75]&/@(#[[2]]/.$characterCardFull)," "] }&/@ SortBy[ Select[ $GOTCharactersInAnotherFilms, StringMatchQ[ ToLowerCase@#[[1]],___~~"star wars"~~___ ]& ], -Last[#]& ], Background->GrayLevel[0.95], ItemSize->{{25,45},Automatic}, Dividers->{None,{None,{LightGray},None}}, Alignment->{{Center,Left},Center} ]

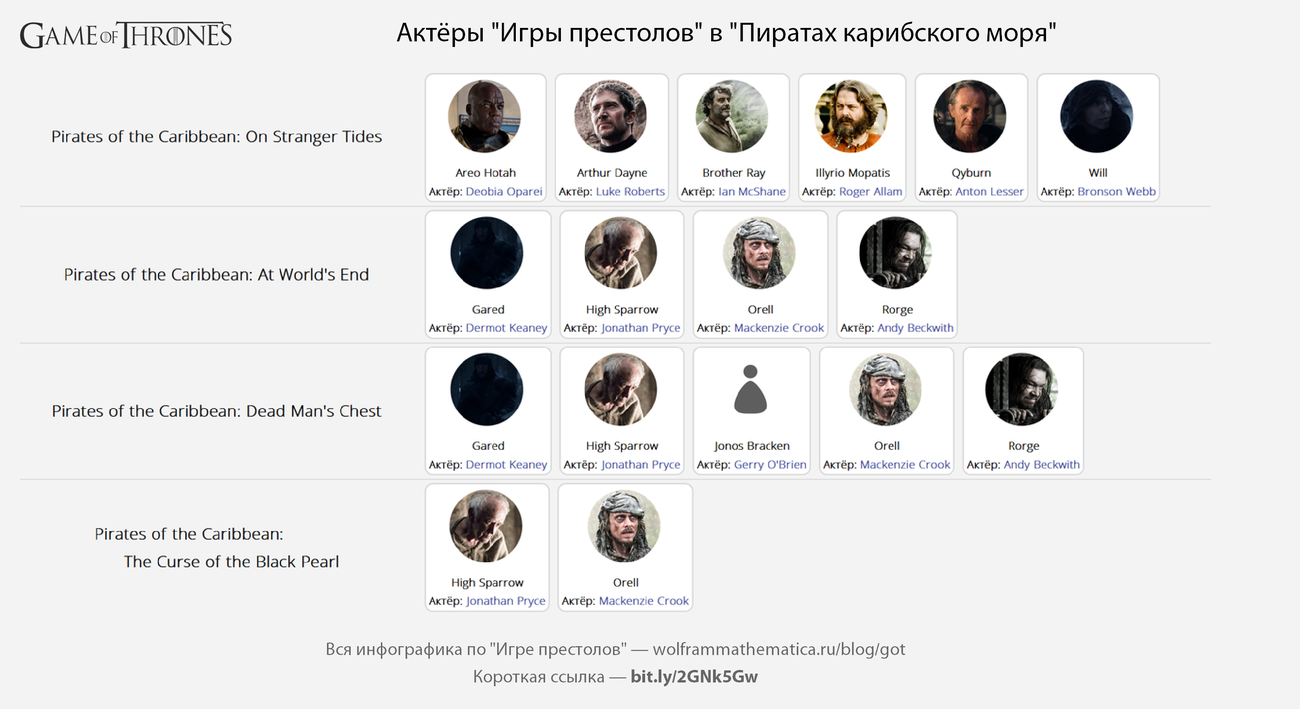
Atores de Game of Thrones em Piratas do Caribe
GOTInfographicsPoster[ #, " \" \" \" \"", "ImageSize"->1300 ]&@ Grid[ { Style[#[[1]],FontFamily->"Open Sans Light",16,Bold], Row[Magnify[#,0.75]&/@(#[[2]]/.$characterCardFull)," "] }&/@ SortBy[ Select[ $GOTCharactersInAnotherFilms, StringMatchQ[ ToLowerCase@#[[1]],___~~"pirates of the"~~___ ]& ], -Last[#]& ], Background->GrayLevel[0.95], ItemSize->{{25,50},Automatic}, Dividers->{None,{None,{LightGray},None}}, Alignment->{{Center,Left},Center} ]
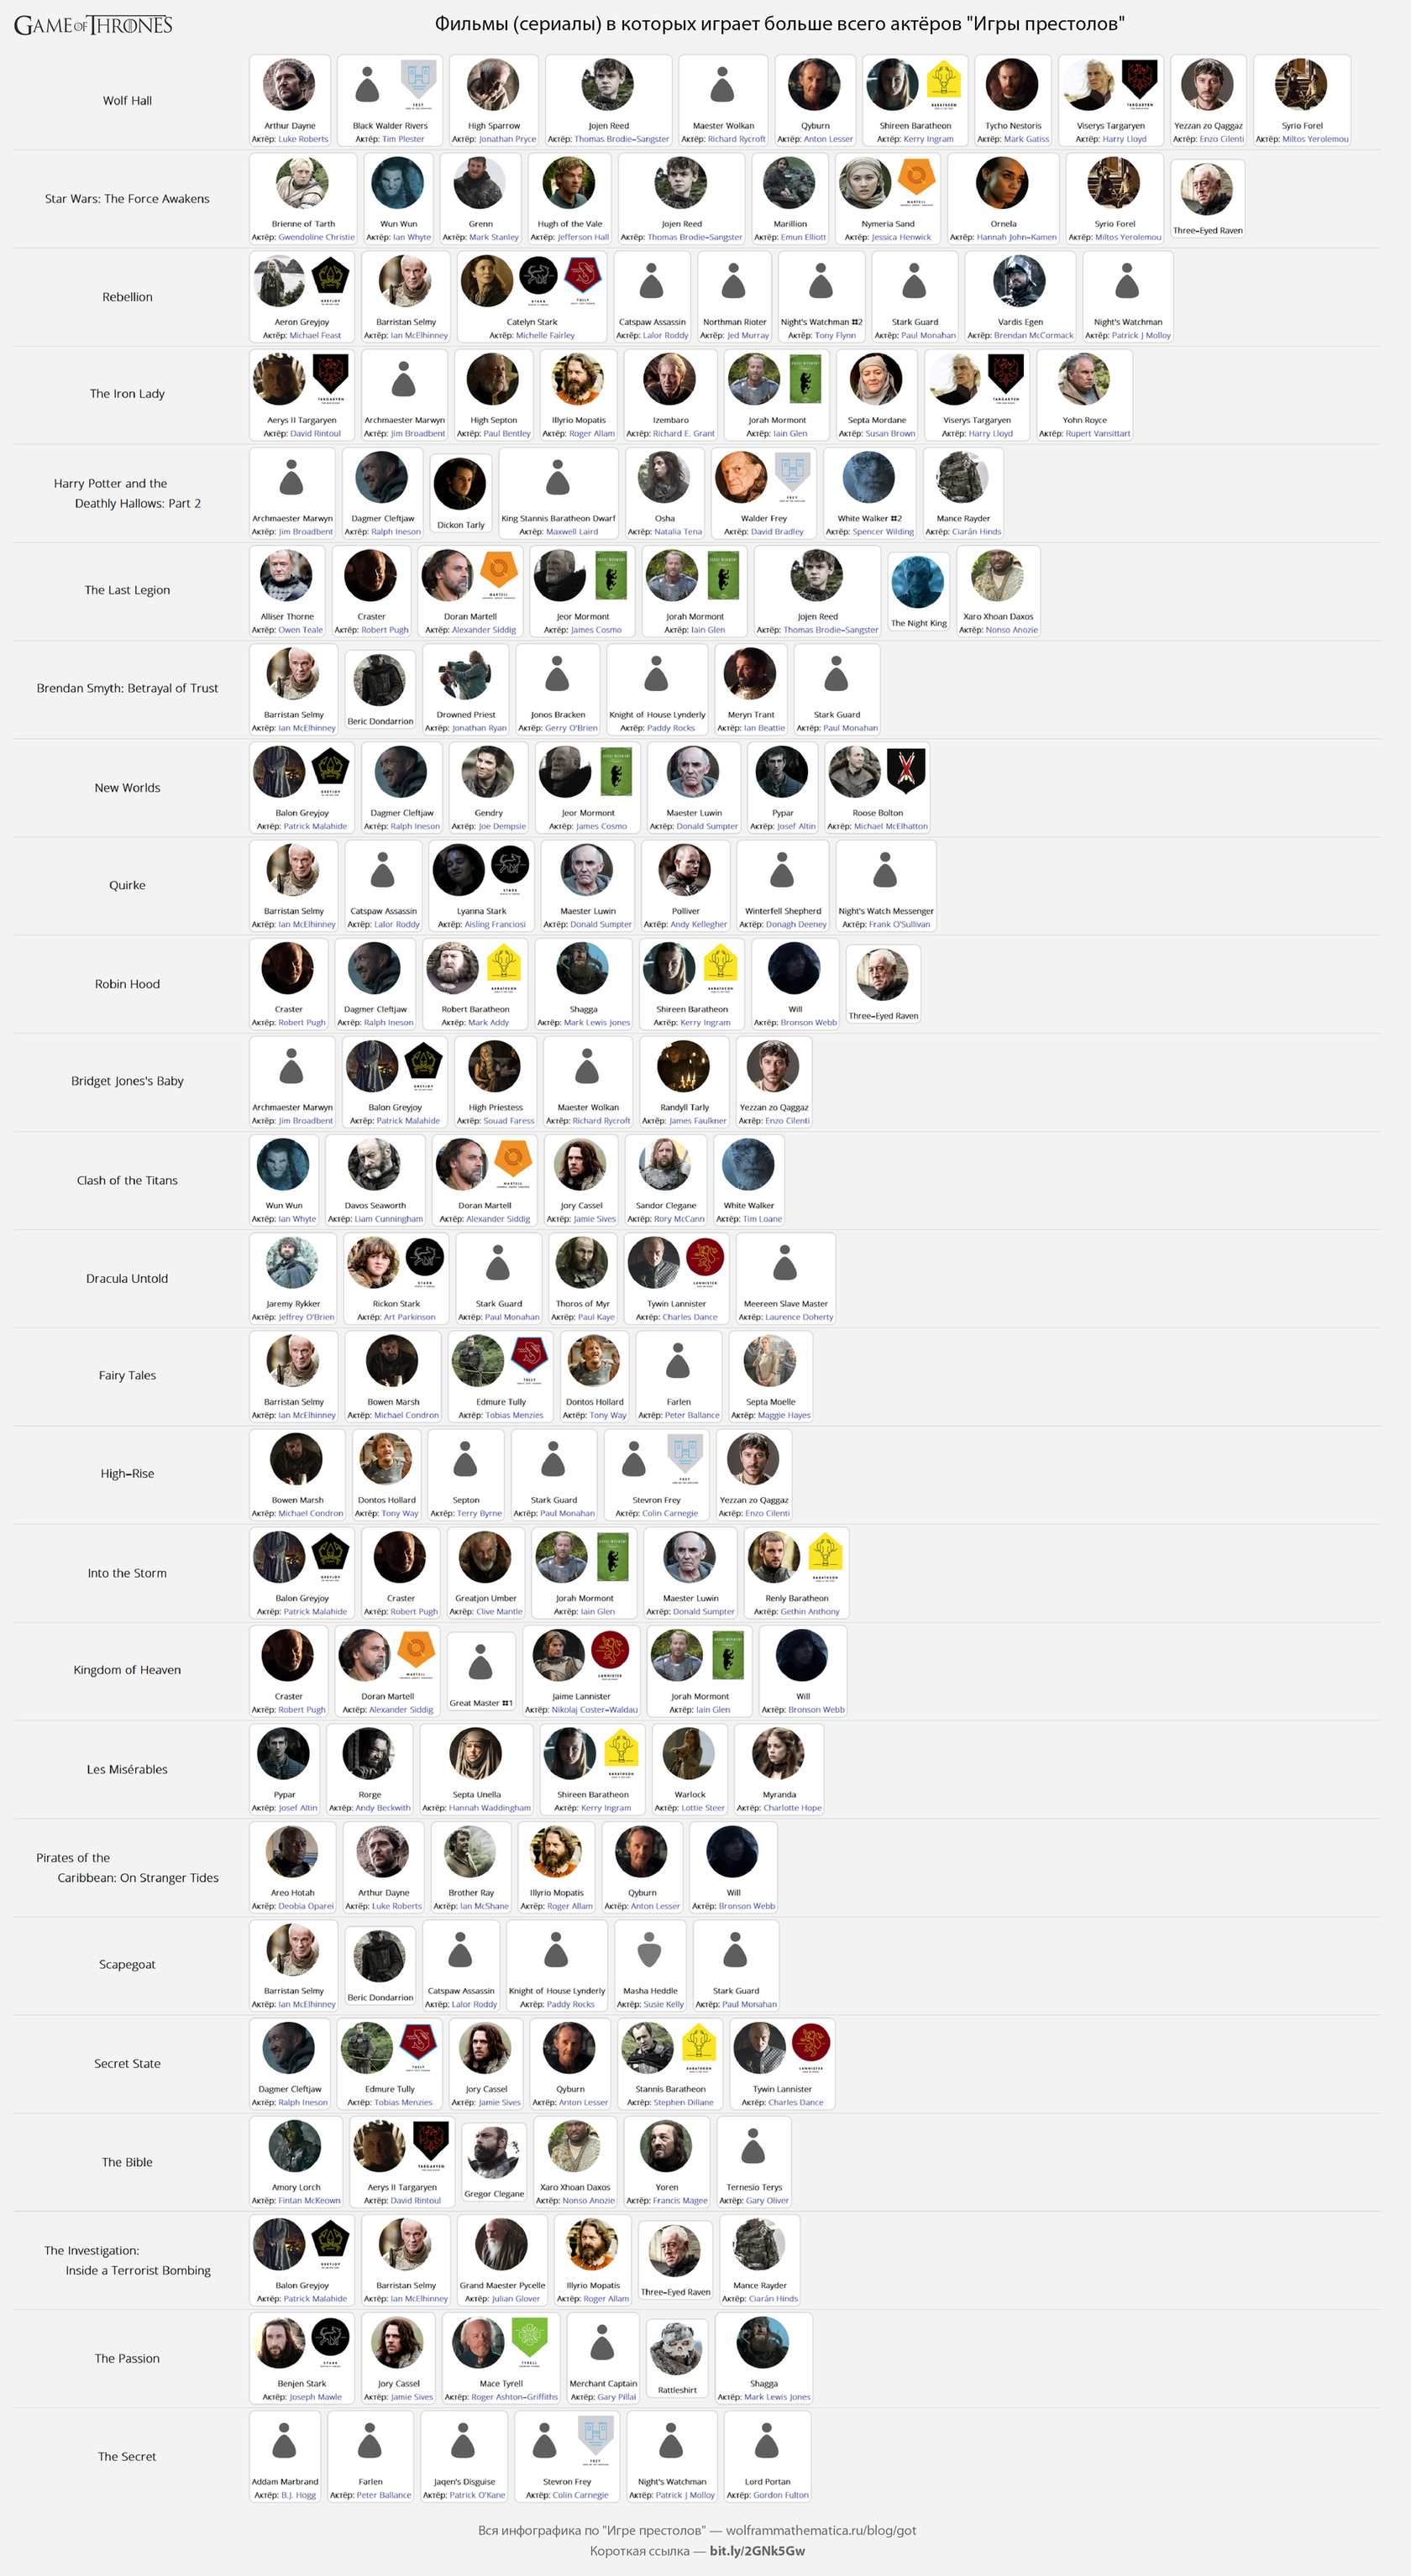
Em que filmes / séries existem muitos atores de Game of Thrones
GOTInfographicsPoster[ #, " () \" \"", "ImageSize"->2000 ]&@ Grid[ { Style[#[[1]],FontFamily->"Open Sans Light",16,Bold], Row[Magnify[#,0.75]&/@(#[[2]]/.$characterCardFull)," "] }&/@ SortBy[ Select[$GOTCharactersInAnotherFilms,Length[#[[2]]]>5&], -Length[#[[2]]]& ], Background->GrayLevel[0.95], ItemSize->{{20,100},Automatic}, Dividers->{None,{None,{LightGray},None}}, Alignment->{{Center,Left},Center} ]
(
original )
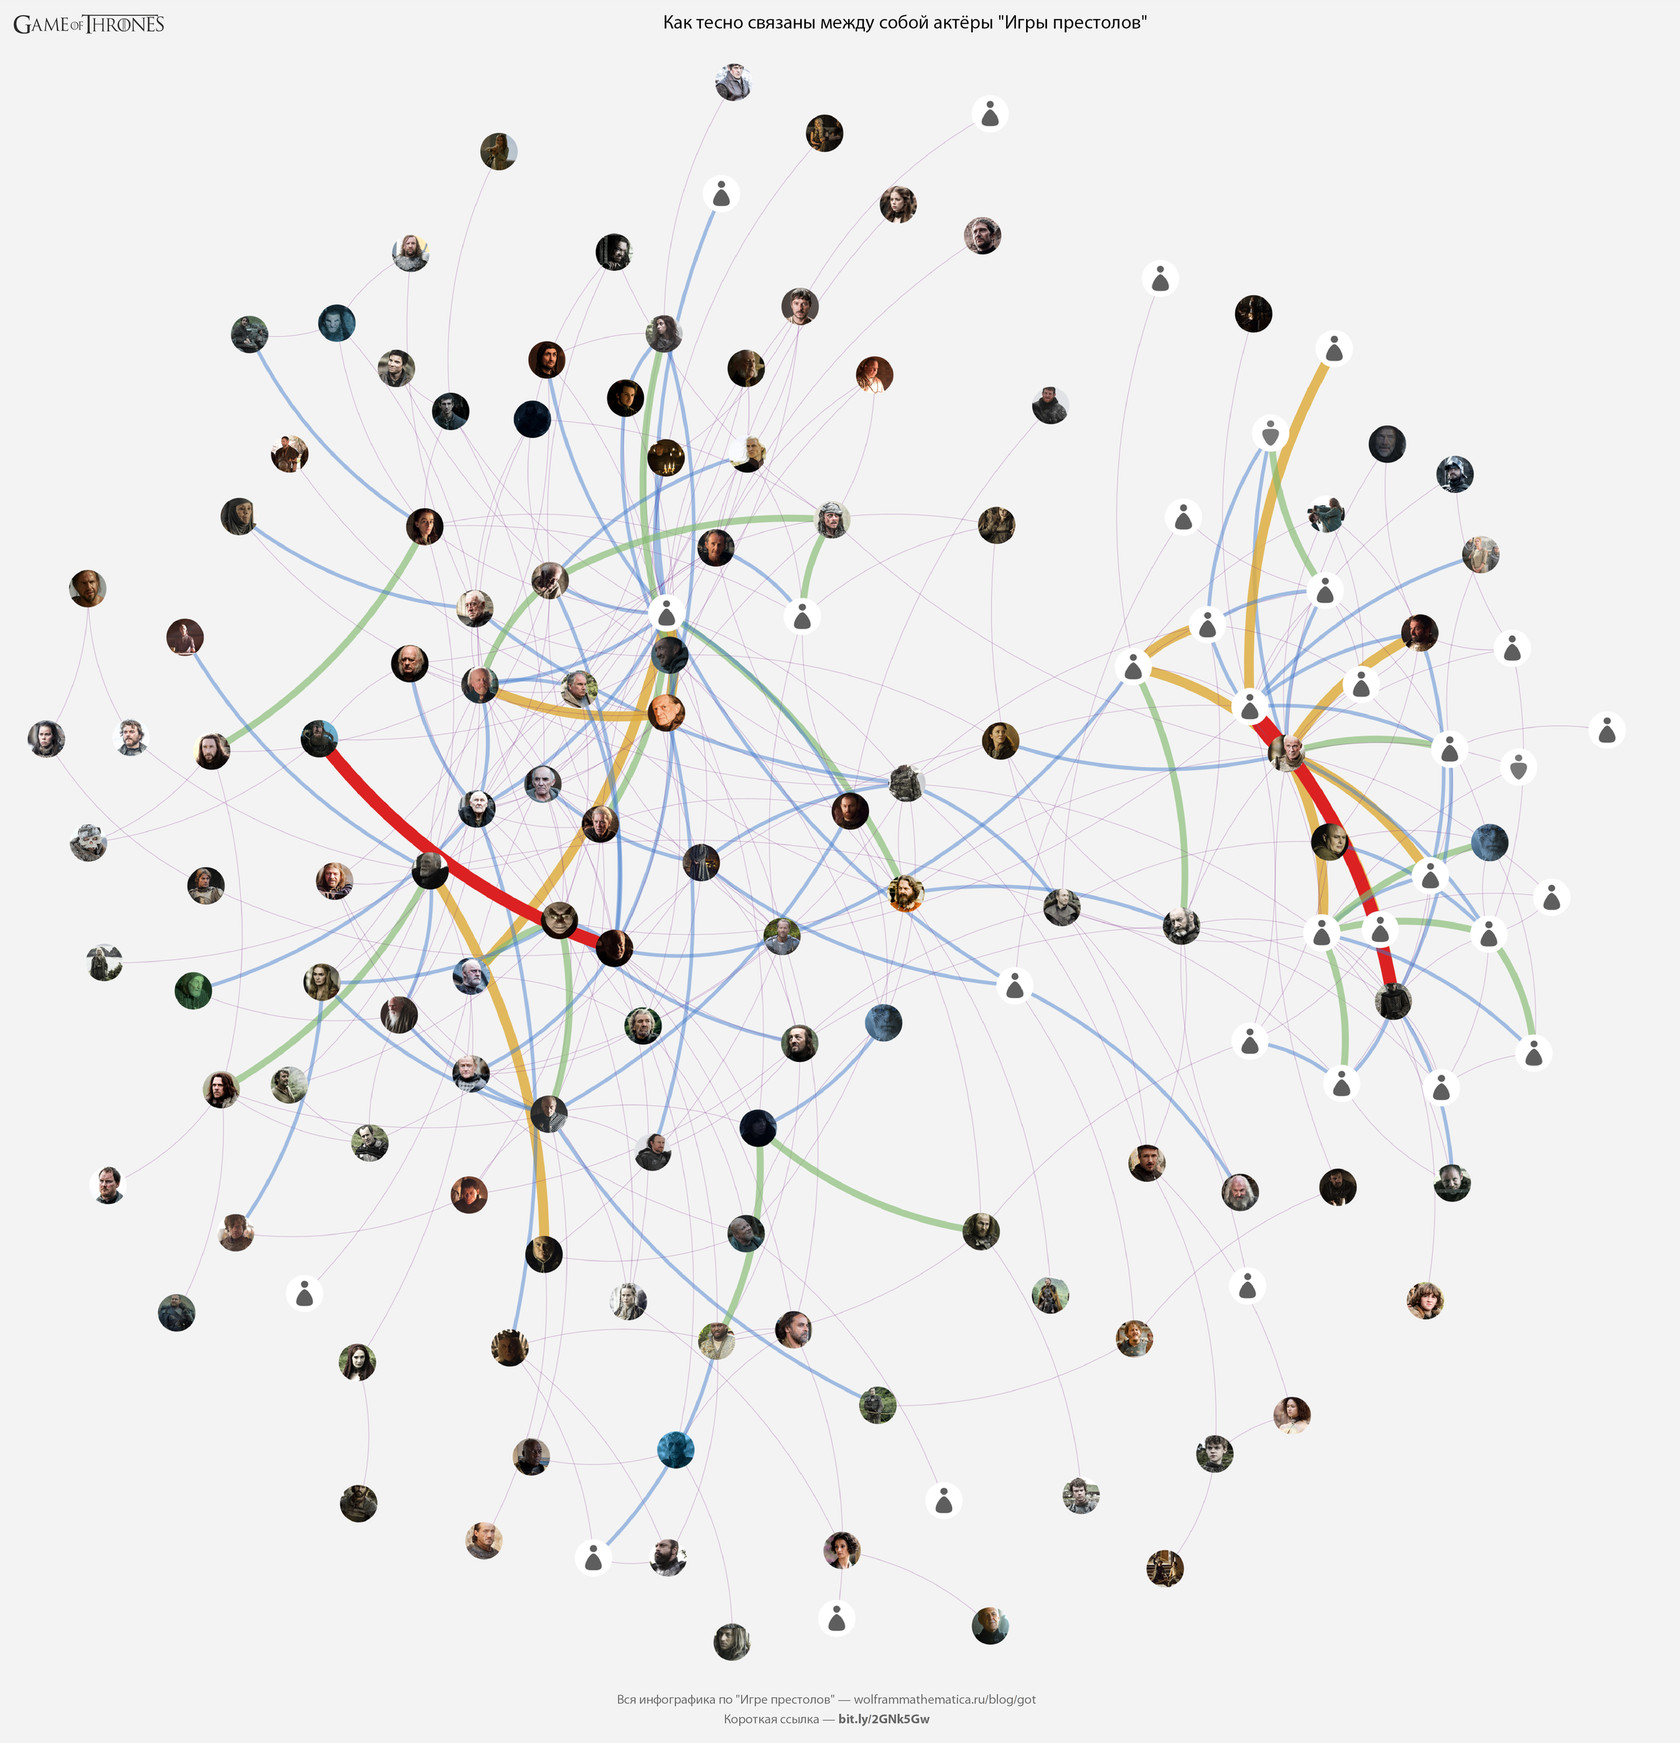
Quão intimamente relacionados estão os atores de Game of Thrones
Construiremos um gráfico mostrando quantas imagens (filmes, séries, etc.) os atores de Game of Thrones interpretaram juntos. Quanto mais grossa e mais vermelha a linha, as imagens mais comuns desse par de atores. (
Original )
GOTInfographicsPoster[ #, " \" \"", "ImageSize"->2500 ]&@ ( ConnectedGraphComponents[ GOTGraphPlot[#,1,"ImageSize"->2500,"MaxThickness"->20] ][ [1] ]&@ Tally[ UndirectedEdge@@@ Map[ Sort, Flatten[ Map[ Subsets[#,{2}]&, Select[ Values[GOTRawData["costars.json"]][ [ ;;, "actors", All, "characterName" ] ], Length[#]>1& ] ], 1 ] ] ] )
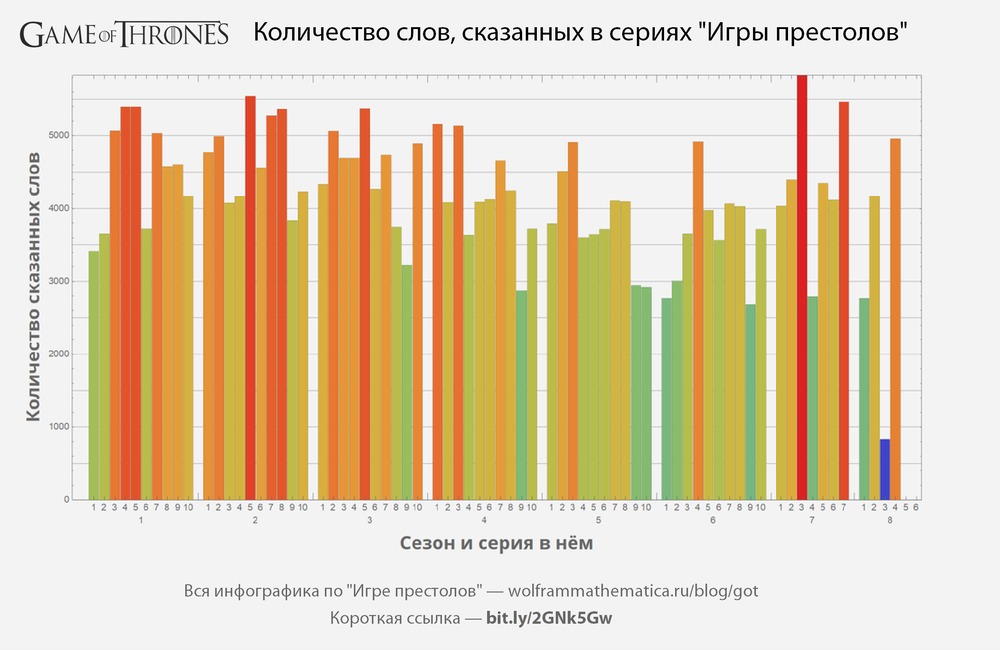
Conversas em Game of Thrones
Muitos amam The Game of Thrones pelo diálogo. Vamos ver em qual série deles mais:
GOTInfographicsPoster[ #, " , \" \"", "ImageSize"->1000 ]&@ BarChart[ #, BarSpacing->{0.05,1}, AspectRatio->1/2, ImageSize->1000, ChartLabels->{Keys[#],Range[10]}, ColorFunction->Function[{x},ColorData["Rainbow"][x]], GridLines->{None,Range[0,10000,500]}, FrameLabel-> Map[ Style[#,FontFamily->"Open Sans",20,Bold]&, {" "," "} ], Frame->True, Background->GrayLevel[0.95], PlotRangePadding->0, PlotRange->All ]&@ GroupBy[ Map[ {#[[1;;2]],Total[#[[3]][[;;,"count"]]]}&, Lookup[ GOTRawData["wordcount.json"]["count"], {"seasonNum","episodeNum","text"} ] ], #[[1,1]]&, #[[;;,2]]& ]
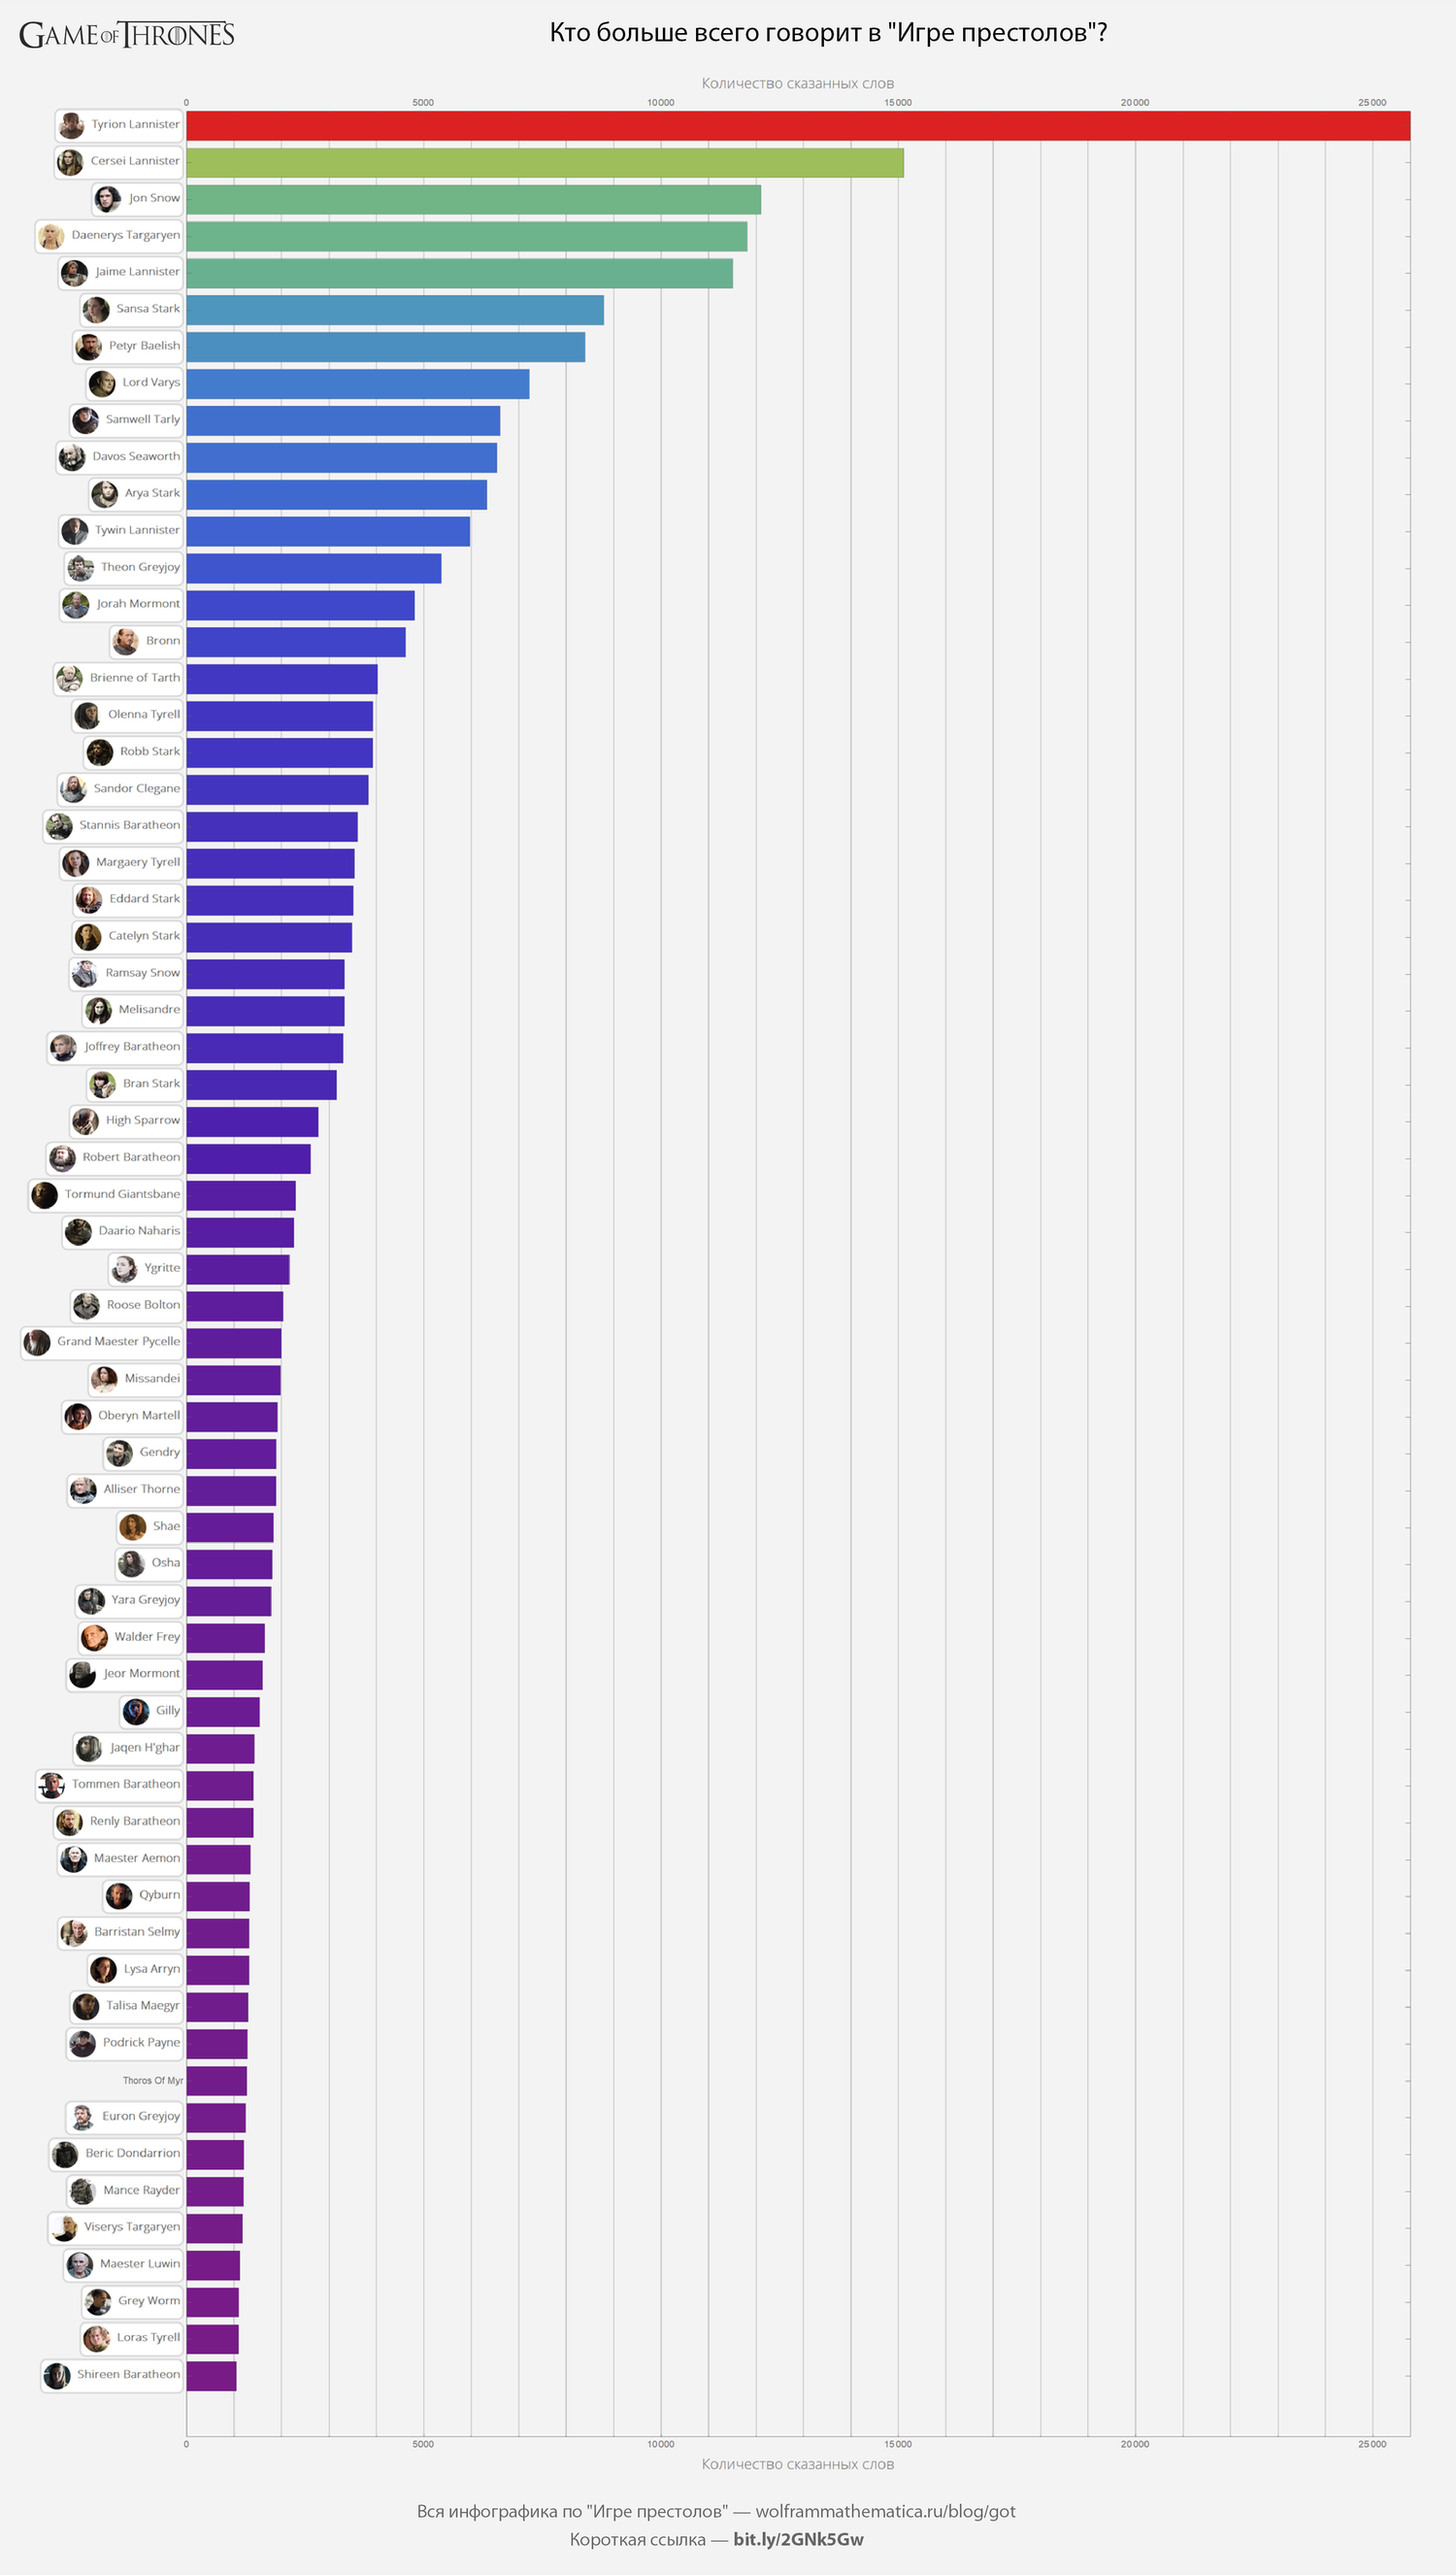
Vamos descobrir quem é o mais "falador" em "Game of Thrones" - a resposta é bastante previsível, mas a separação de Tyrion é quase duas vezes a do personagem mais próximo dele.
GOTInfographicsPoster[ #1, " \" \"?", "ImageSize"->1500 ]&@ ( ( BarChart[ #1[[1;;All,1]], PlotRangePadding->0, BarSpacing->0.25, BarOrigin->Left, AspectRatio->1.9, ImageSize->1500, ChartLabels->#1[[1;;All,2]], Frame->True, GridLines->{Range[0,10^5,10^3],None}, ColorFunction->ColorData["Rainbow"], FrameLabel-> { {None,None}, Style[#,FontFamily->"Open Sans Light",16]&/@ { " ", " " } }, FrameTicks->{Automatic,{All,All}}, Background->GrayLevel[0.95] ]& )[ KeyValueMap[ {#2,#1/.$characterCardShortSmall}&, Select[ SortBy[ GroupBy[ Flatten[ GOTRawData["wordcount.json"]["count"][ [;;,"text"] ] ], #[["name"]]&, Total[#[[;;,"count"]]]& ], #& ], #>1000& ] ] ] )
Por fim, construímos um diagrama mostrando a quantidade de tempo na tela e o número de palavras faladas pelo personagem:
GOTInfographicsPoster[ #1, " \" \"\n( )", "ImageSize"->2000 ]&@ Module[{data1,data2,intersection}, data1= Merge[ $GOTEpisodeData[[;;,"ScreenTime"]],Total[Flatten[#]]& ]; data2= GroupBy[ Flatten[ GOTRawData["wordcount.json"]["count"][[;;,"text"]] ], #[["name"]]&, Total[#[[;;,"count"]]]& ]; intersection=Intersection[Keys@data1,Keys@data2]; ListPlot[ Callout[{data1[#],data2[#]},#/.$characterCardShortSmall]&/@ intersection, AspectRatio->1, ImageSize->2000, PlotRange->All, ScalingFunctions->{"Log10","Log10"}, GridLines-> { {10,100}~Join~Range[0,10^5,1000], {10,100}~Join~Range[0,10^5,1000] }, Frame->True, FrameTicks->All, FrameLabel-> ReplaceAll[ { {1,1}" ", {1,1}" , " }, x_String:>Style[x,FontFamily->"Open Sans",20,Bold] ], Background->GrayLevel[0.95], PlotMarkers->{Automatic,Small}, GridLinesStyle->GrayLevel[0.85] ] ]
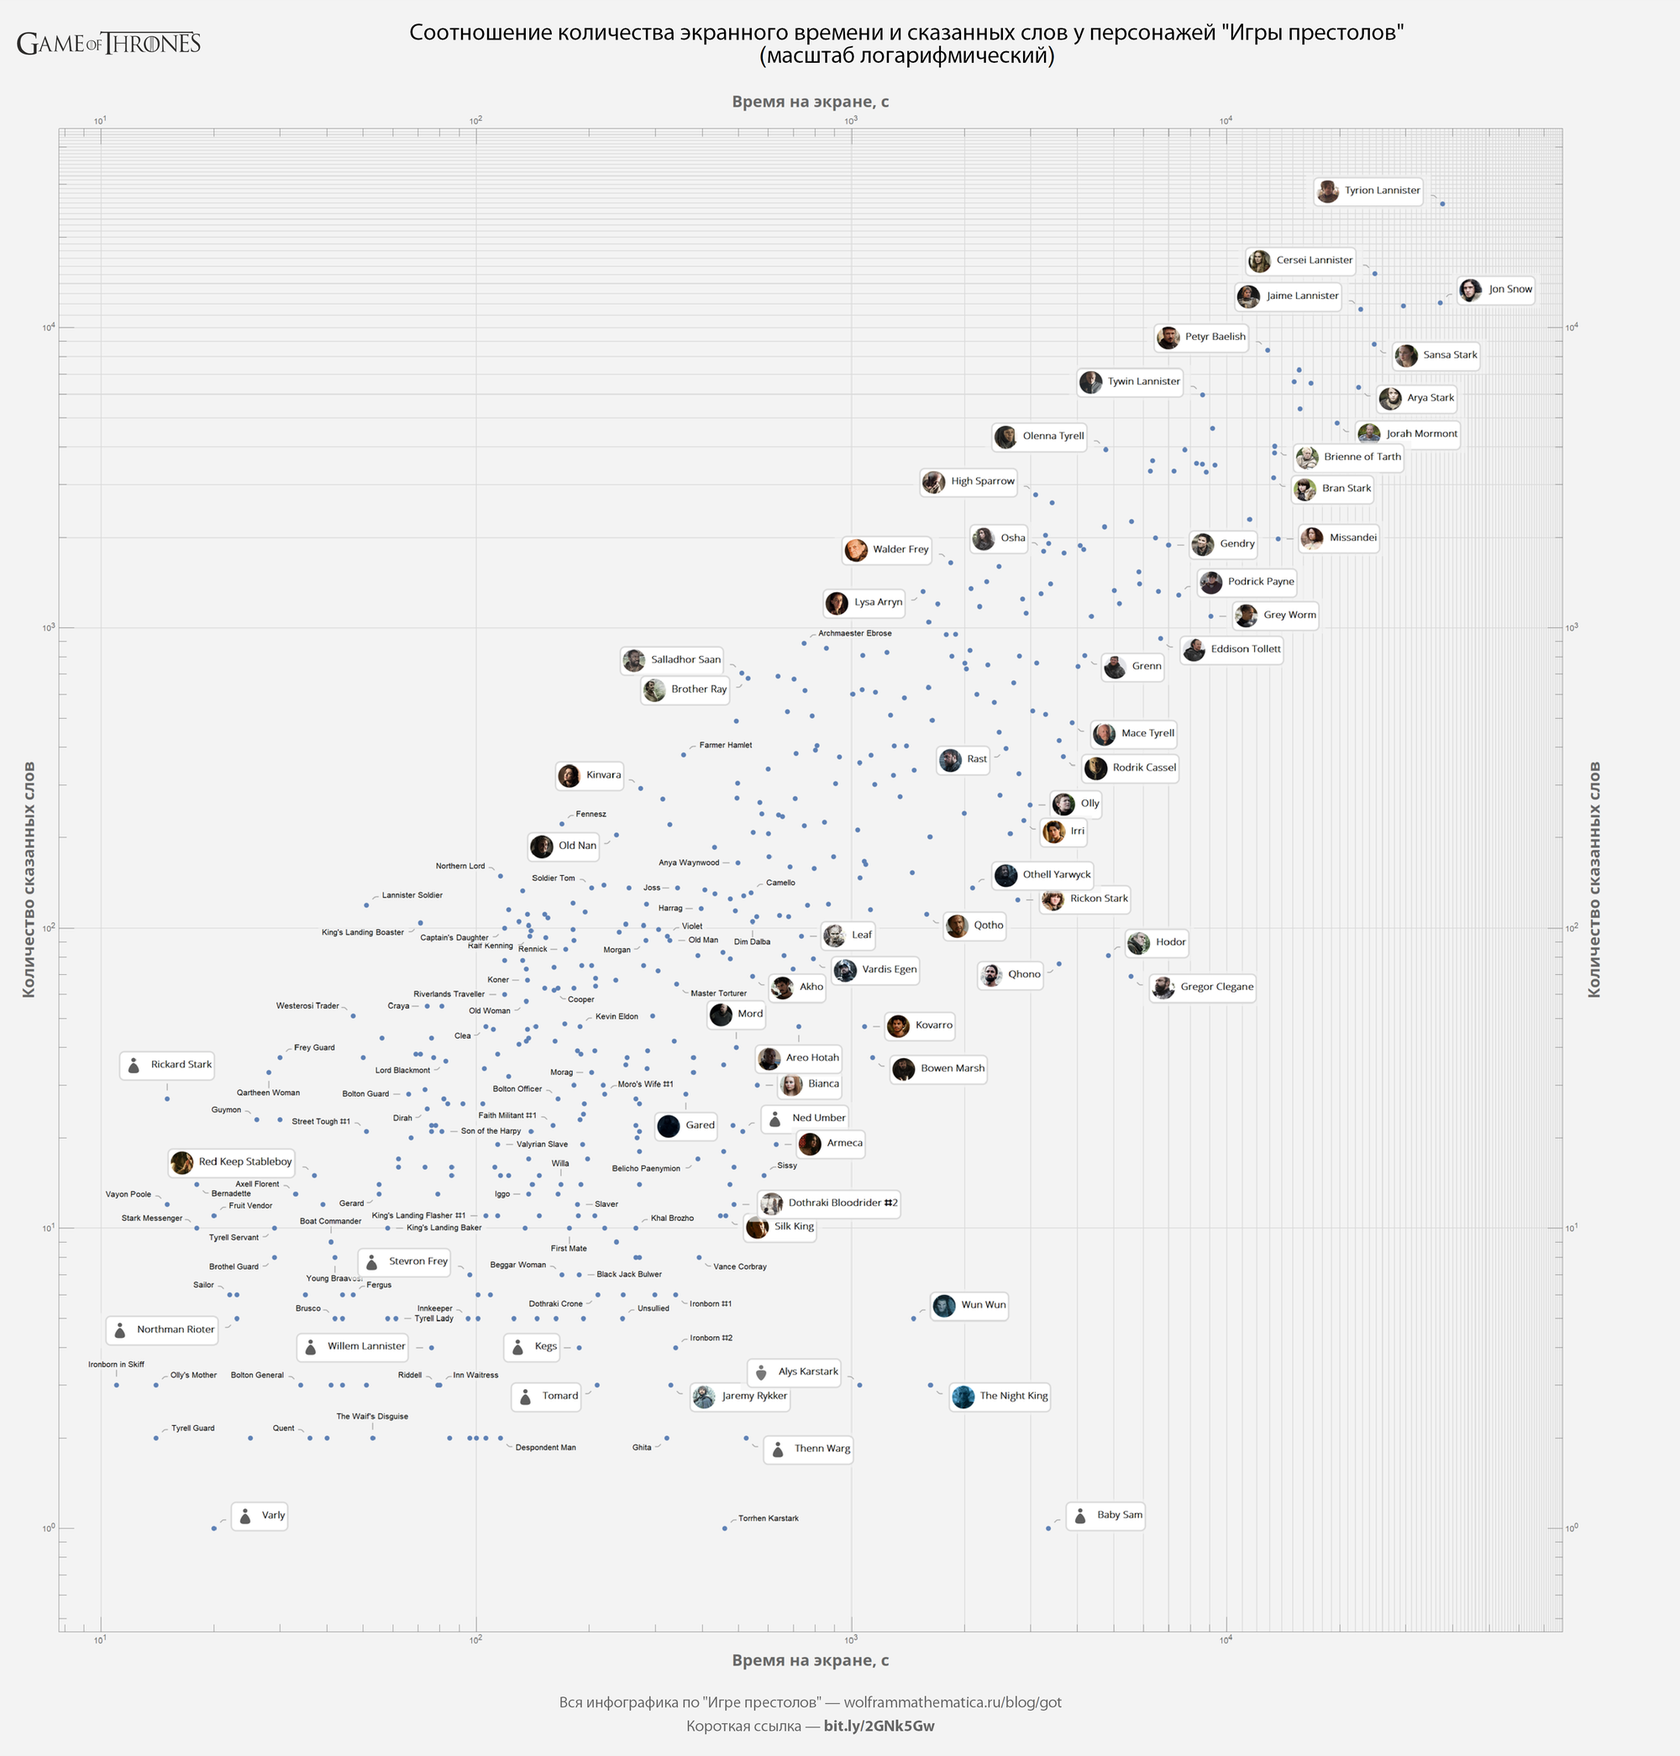
(
original )
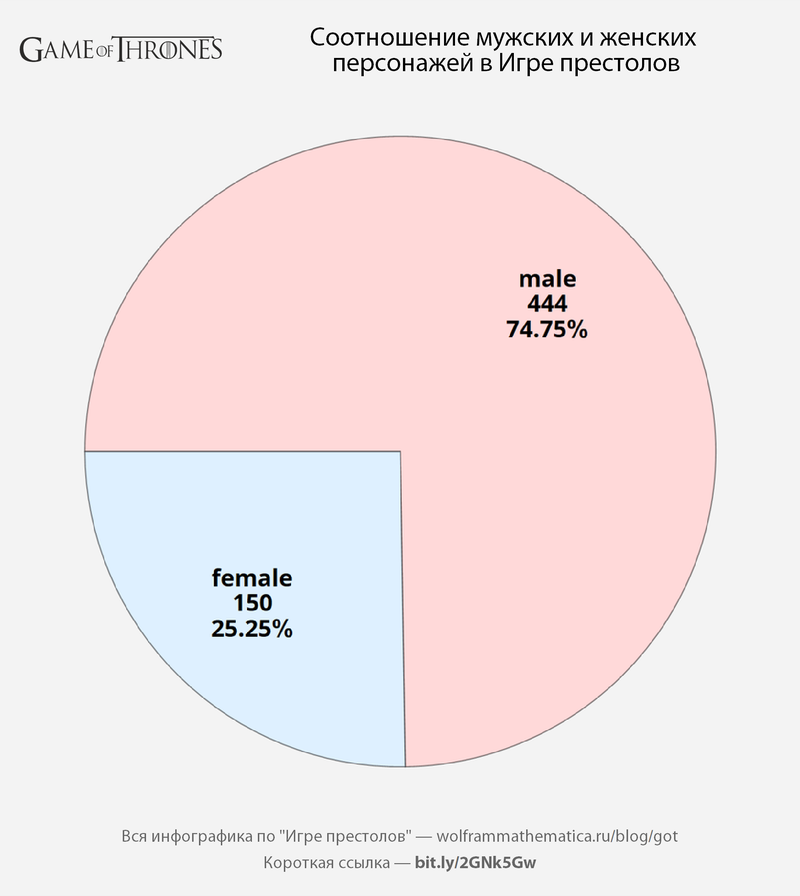
Personagens de Gender of Game of Thrones: quem é mais, homem ou mulher?
Sexo por nome do personagem:
$gender= <| Flatten[ KeyValueMap[ Thread[#2->#1]&,GOTRawData["characters-gender-all.json"] ] ] ~ Join ~ { "Aegon Targaryen"->"male", "Aerys II Targaryen"->"male", "Archmaester Marwyn"->"male", "Baratheon Guard"->"male", "Brandon Stark"->"male", "Child of the Forest"->"male", "Elia Martell"->"female", "Eon Hunter"->"male", "Goldcloak #1"->"male", "Goldcloak #2"->"male", "Knight of House Frey"->"male", "Knight of House Lynderly"->"male", "Kurleket"->"male", "Lannister Guardsman"->"male", "Lord Galbart Glover"->"male", "Male Prostitute"->"male", "Masha Heddle"->"female", "Meereen Slave Master"->"male", "Mikken"->"male", "Night's Watch Deserter"->"male", "Night's Watch Messenger"->"male", "Night's Watch Officer"->"male", "Pentoshi Servant"->"male", "Rhaella Targaryen"->"female", "Rhaenys Targaryen"->"female", "Stark Bannerman"->"male", "Stark Guard"->"male", "Wedding Band"->"male", "White Walker #2"->"male", "Willis Wode"->"male", "Young Ned"->"male" }|>
A proporção dos personagens de "Game of Thrones" por gênero - é claro que existem 3 homens por mulher. Às vezes parece que os personagens masculinos são apenas uma comitiva para os poderosos).
GOTInfographicsPoster[ #," " ]&@ Module[{labels,counts,percents}, {labels,counts}=Transpose[Tally[Values[$gender]]]; percents=PercentForm/@N[counts/Total[counts]]; PieChart[ counts, ChartLabels-> Map[ Style[ Row[#,"\n"], 20, Bold, Black, FontFamily->"Open Sans" ]&, Transpose[{labels,counts,percents}] ], ChartStyle->{LightRed,LightBlue}, ImageSize->600, Background->GrayLevel[0.95] ] ]
 , .
, .— .
YouTube — .
. .