Metas e requisitos para testar "Contabilidade 1C"
O principal objetivo do teste é comparar o comportamento do sistema 1C em dois DBMSs diferentes sob outras condições idênticas. I.e. a configuração dos bancos de dados 1C e a população de dados inicial devem ser as mesmas durante cada teste.
Os principais parâmetros que devem ser obtidos durante o teste:
- O tempo de execução de cada teste (removido pelo Departamento de Desenvolvimento 1C)
- A carga no DBMS e no ambiente do servidor durante o teste é removida pelos administradores do DBMS, bem como no ambiente do servidor pelos administradores do sistema
O teste do sistema 1C deve ser realizado levando em consideração a arquitetura cliente-servidor; portanto, é necessário emular um usuário ou vários usuários do sistema, trabalhando com a entrada de informações na interface e armazenando essas informações no banco de dados. Ao mesmo tempo, é necessário que uma grande quantidade de informações periódicas seja lançada durante um longo período de tempo para criar totais nos registros de acumulação.
Para executar o teste, um algoritmo foi desenvolvido na forma de um script para teste de script, para a configuração do 1C Accounting 3.0, na qual é executada a entrada serial dos dados de teste no sistema 1C. O script permite especificar várias configurações para as ações executadas e a quantidade de dados de teste. Descrição detalhada abaixo.
Descrição das configurações e características dos ambientes testados
Nós da Fortis decidimos checar os resultados, inclusive usando o conhecido
teste de Gilev .
Também fomos incentivados a testar, incluindo algumas publicações sobre os resultados das alterações de desempenho durante a transição do MS SQL Server para o PostgreSQL. Como:
1C Battle: PostgreSQL 9.10 vs MS SQL 2016 .
Então, aqui está a infraestrutura para teste:
Os servidores para MS SQL e PostgreSQL eram virtuais e foram executados alternadamente para o teste desejado. 1C estava em um servidor separado.
DetalhesEspecificação do hipervisor:Modelo: Supermicro SYS-6028R-TRT
CPU: CPU Intel® Xeon® E5-2630 v3 a 2.40GHz (2 meias * 16 CPU HT = 32CPU)
RAM: 212 GB
SO: VMWare ESXi 6.5
PowerProfile: Desempenho
Subsistema de disco do hipervisor:Controlador: Adaptec 6805, tamanho do cache: 512MB
Volume: RAID 10, 5,7 TB
Tamanho da faixa: 1024 KB
Cache de gravação: ativado
Cache de leitura: desativado
Rodas: 6 unid. HGST HUS726T6TAL,
Tamanho do setor: 512 bytes
Cache de gravação: ativado
O PostgreSQL foi configurado da seguinte maneira:- postgresql.conf:
As configurações básicas foram feitas usando a calculadora - pgconfigurator.cybertec.at , os parâmetros Huge_pages, checkpoint_timeout, max_wal_size, min_wal_size, random_page_cost alterados com base nas informações recebidas das fontes mencionadas no final da publicação. O valor do parâmetro temp_buffers aumentou, com base na sugestão de que 1C usa ativamente tabelas temporárias:
listen_addresses = '*' max_connections = 1000
- Kernel, parâmetros do SO:
As configurações são definidas no formato de arquivo de perfil para o daemon ajustado:
[sysctl]
- Sistema de arquivos:
Todo o conteúdo do arquivo postgresql.conf:
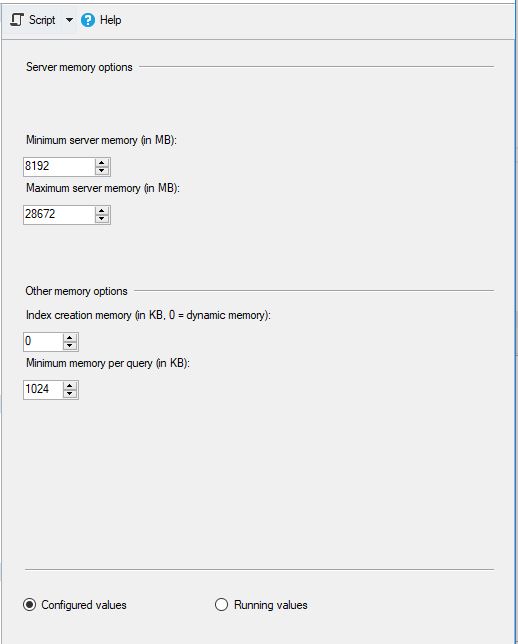
MS SQL foi configurado da seguinte maneira: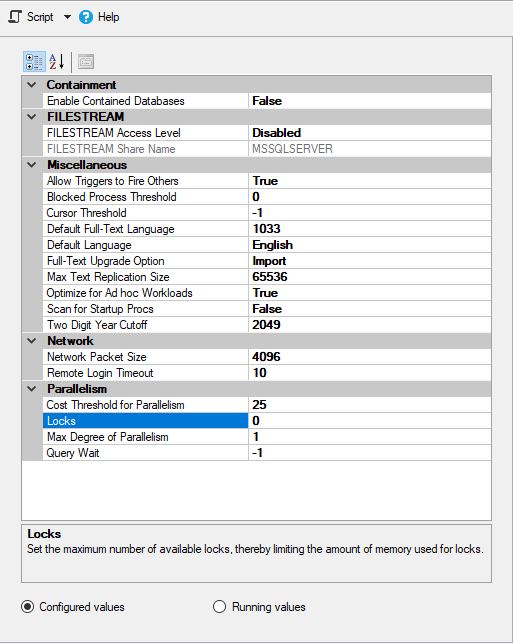
e
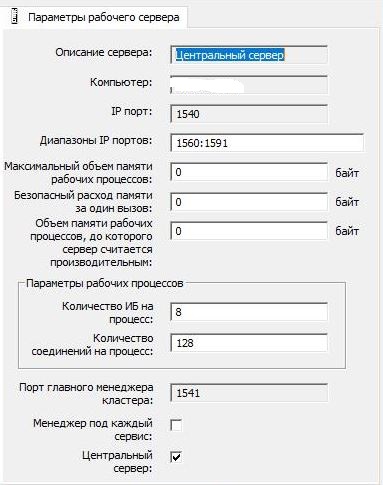
As configurações do cluster 1C foram deixadas padrão:
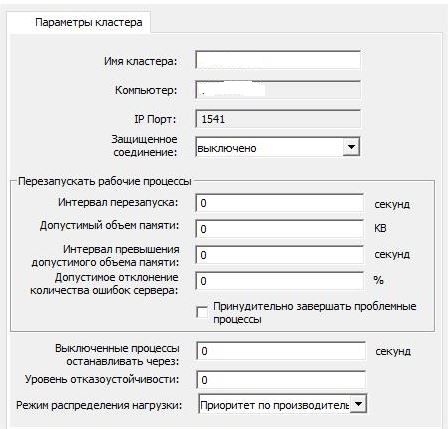
e
Não havia nenhum programa antivírus nos servidores e nada de terceiros foi instalado.
Para o MS SQL, o tempdb foi movido para uma unidade lógica separada. No entanto, os arquivos de dados e os arquivos de log de transações dos bancos de dados estavam localizados na mesma unidade lógica (ou seja, os arquivos de dados e os logs de transações não foram divididos em unidades lógicas separadas).
As unidades de indexação no Windows, onde o MS SQL Server estava localizado, foram desativadas em todas as unidades lógicas (como é habitual na maioria dos casos em ambientes prodovskih).
Descrição do algoritmo principal do script para teste automatizadoO principal período estimado de teste é de 1 ano, durante o qual documentos e informações de referência são criados para cada dia, de acordo com os parâmetros especificados.
Em cada dia de execução, são lançados blocos de entrada e saída de informações:
- Bloco 1 "_" - "Recebimento de bens e serviços"
- O diretório de contrapartes é aberto
- Um novo elemento do diretório "Empreiteiros" é criado com uma visão de "Fornecedor"
- Um novo elemento do diretório "Contratos" é criado com a visão "Com fornecedor" para uma nova contraparte
- O diretório "Nomenclatura" é aberto
- Um conjunto de elementos do diretório "Nomenclatura" é criado com o tipo "Produto"
- Um conjunto de elementos do diretório "Nomenclatura" é criado com o tipo "Serviço"
- A lista de documentos “Recebimentos de bens e serviços” é aberta.
- Um novo documento “Entrada de mercadorias e serviços” é criado no qual as partes tabulares “Bens” e “Serviços” são preenchidas com os conjuntos de dados criados
- O relatório "Cartão de conta 41" é gerado para o mês atual (se o intervalo para formação adicional for indicado)
- Bloco 2 "_" - "Vendas de bens e serviços"
- O diretório de contrapartes é aberto
- Um novo elemento do diretório "Contrapartes" é criado com a visão "Comprador"
- Um novo elemento do diretório "Contratos" é criado com a visão "Com comprador" para uma nova contraparte
- Uma lista de documentos "Vendas de bens e serviços" é aberta.
- Um novo documento "Vendas de bens e serviços" é criado no qual as partes tabulares "Bens" e "Serviços" são preenchidas de acordo com os parâmetros especificados nos dados criados anteriormente
- O relatório "Cartão de conta 41" é gerado para o mês atual (se o intervalo para formação adicional for indicado)
- O relatório "Cartão de conta 41" para o mês atual é gerado
No final de cada mês em que a criação dos documentos foi realizada, são executados blocos de entrada e saída de informações:
- O relatório "Cartão de conta 41" é gerado do início do ano até o final do mês
- O relatório “Balanço de rotatividade” é gerado do início do ano até o final do mês
- O procedimento regulatório “Fechamento do mês” está sendo realizado.
O resultado da execução fornece informações sobre o tempo do teste em horas, minutos, segundos e milissegundos.
Principais recursos do script de teste:- Capacidade de desativar / ativar unidades individuais
- Capacidade de especificar o número total de documentos para cada um dos blocos
- Capacidade de especificar o número de documentos para cada bloco por dia
- Capacidade de indicar a quantidade de bens e serviços nos documentos
- Capacidade de definir listas de indicadores quantitativos e de preços para gravação. Serve para criar diferentes conjuntos de valores em documentos
O plano de teste básico para cada um dos bancos de dados:- "O primeiro teste." Sob um único usuário, um pequeno número de documentos com tabelas simples é criado, “fechamentos mensais” são formados
- — 20 . 1 . : 50 «», 50 «», 100 «», 50 «» + «», 50 «» + «», 2 « ». 1 1
- « ». ,
- — 50-60 . 3 . : 90 «», 90 «», 540 «», 90 «» + «», 90 «» + «», 3 « ». 3 3
- « ». . .
- — 40-60 . 2 . : 50 «», 50 «», 300 «», 50 «» + «», 50 «» + «». 3 3
:- , :
- « » « »
- 1 "*.dt"
- « »
Resultados
E agora os resultados mais interessantes no DBMS do MS SQL Server:Detalhes:
:
:

PostgreSQL,
, , , :
:
:
:

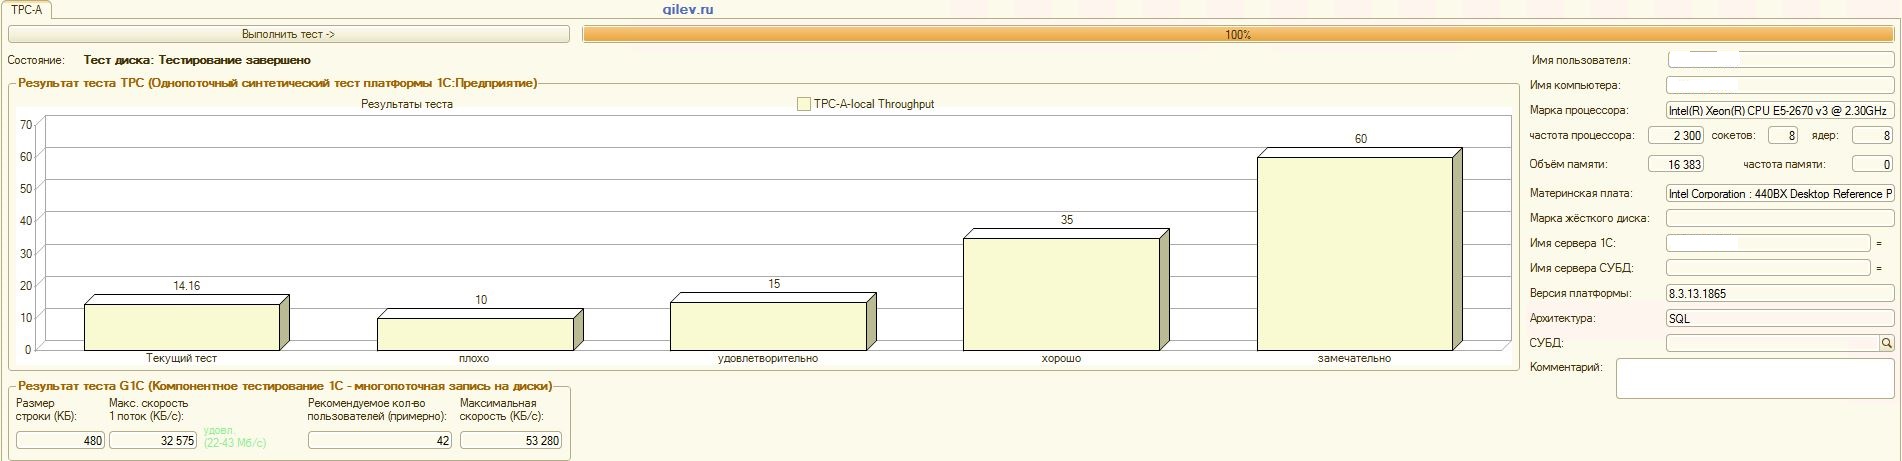
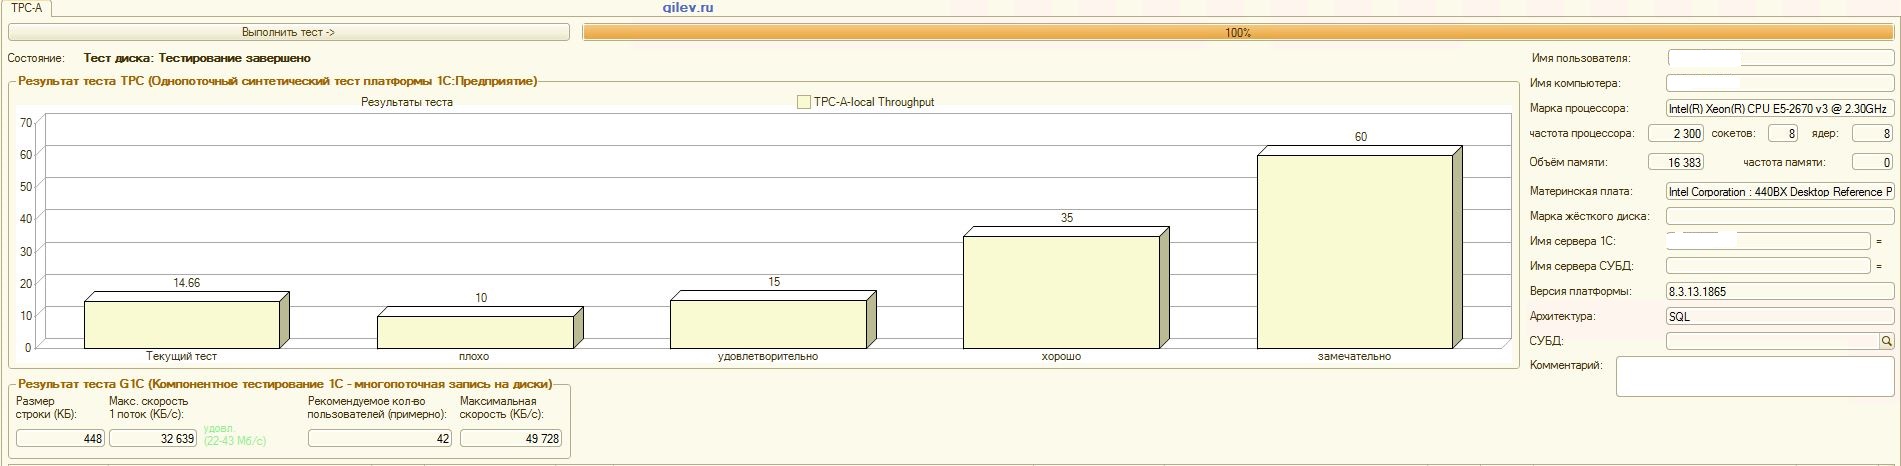
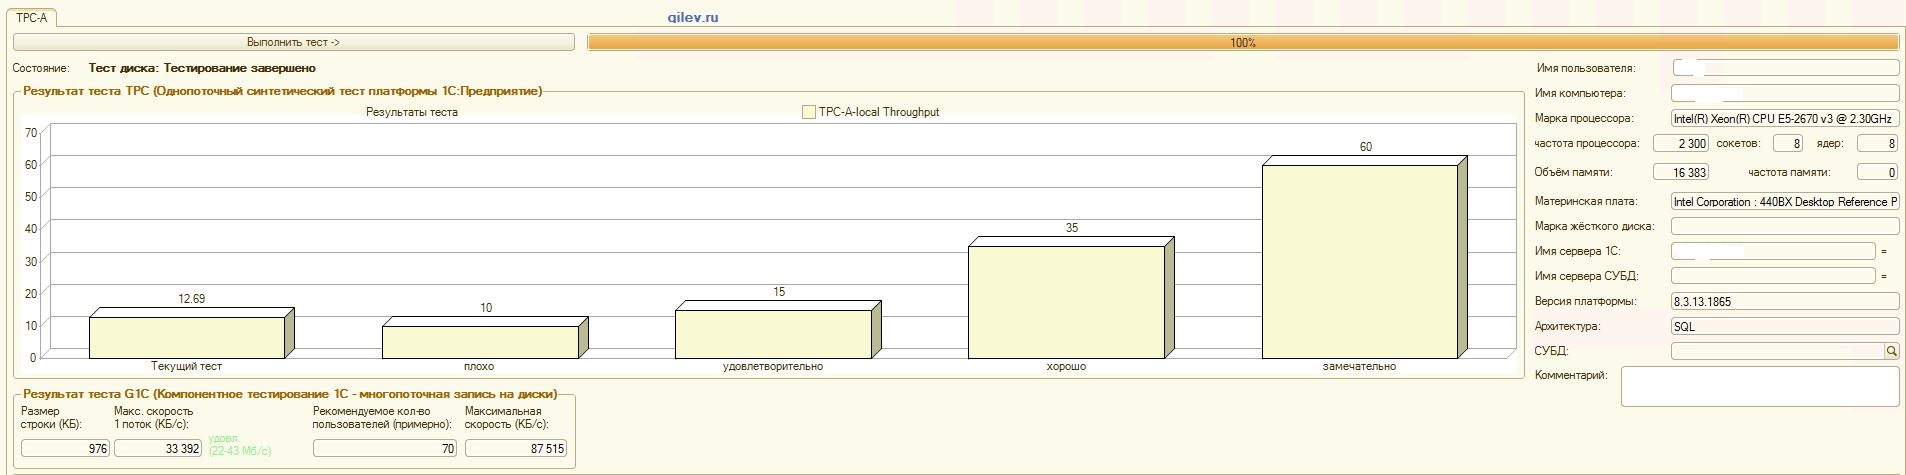
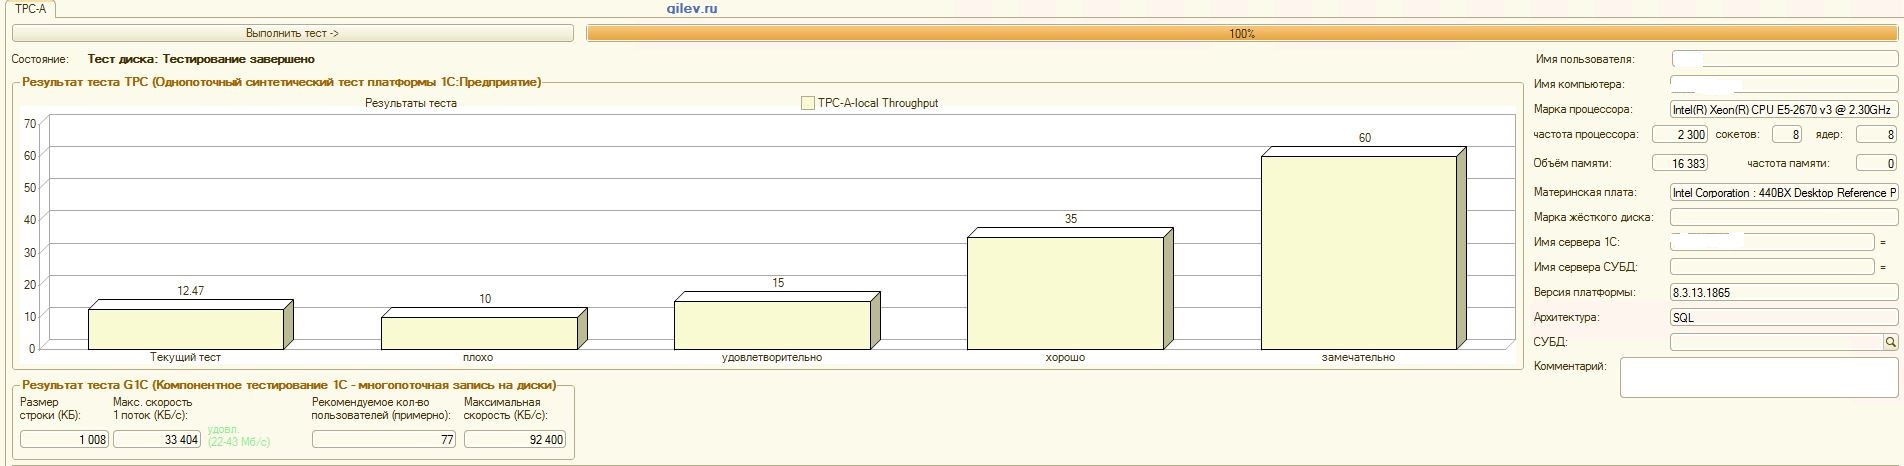
Teste de Gilev:Como pode ser visto nos resultados, o PostgreSQL perdeu uma média de 14,82% do desempenho médio dos DBMSs do MS SQL no teste sintético geral . No entanto, de acordo com os dois últimos indicadores, o PostgreSQL apresentou um resultado significativamente melhor que o MS SQL.Testes especializados para Contabilidade 1C:Como pode ser visto nos resultados, a Contabilidade 1C funciona aproximadamente da mesma forma no MS SQL e no PostgreSQL com as configurações fornecidas acima.Nos dois casos, o DBMS funcionou de maneira estável.Obviamente, você pode precisar de ajustes mais sutis no DBMS, no SO e no sistema de arquivos. Tudo foi feito quando as publicações estavam sendo transmitidas, o que dizia que haveria um aumento significativo na produtividade ou aproximadamente o mesmo ao mudar do MS SQL para o PostgreSQL. Além disso, neste teste, várias medidas foram tomadas para otimizar o sistema operacional e o sistema de arquivos do próprio CentOS, descritos acima., PostgreSQL- . MS SQL 3 , MS SQL . MS SQL.
MS SQL PostgreSQL, 1 , .
, , PostgreSQL MS SQL, , ,
1 MS SQL, PostgreSQL .
, 1 .
1 , . , , 1.
, , 1 8.3 15% PostgreSQL MS SQL. , . , ,
1 8.3 MS SQL PostgreSQL 15%. , 15% , , .
, , 100 , 4. , , 100 (, 1 ), ( ) .
, MS SQL Server 2019 Developer PostgreSQL 12, CentOS, MS SQL Windows Server. PostgreSQL Windows, PostgreSQL .
Obviamente, o teste de Gilev fala geralmente sobre desempenho e não apenas para 1C. No entanto, no momento é muito cedo para dizer que o MS SQL DBMS sempre será significativamente melhor que o PostgreSQL DBMS, porque não há fatos suficientes. Para confirmar ou refutar esta declaração, você precisa fazer vários outros testes. Por exemplo, para o .NET, você precisa escrever ações atômicas e testes complexos, executá-los repetidamente e em diferentes condições, fixar o tempo de execução e obter o valor médio. Em seguida, compare esses valores. Esta será uma análise objetiva.No momento, não estamos prontos para conduzir essa análise, mas no futuro é bem possível realizá-la. Em seguida, escreveremos com mais detalhes sob quais operações o PostgreSQL é melhor que o MS SQL e quanto em porcentagem, e onde o MS SQL é melhor que o PostgreSQL e quanto em porcentagem.Além disso, nosso teste não aplicou métodos de otimização para o MS SQL, descritos aqui . Talvez este artigo tenha esquecido de desativar a indexação de disco do Windows.Ao comparar dois DBMSs, um ponto mais importante deve ser lembrado: o PostgreSQL DBMS é gratuito e aberto, enquanto o MS SQL DBMS é pago e possui código-fonte fechado.Agora, às custas do próprio teste de Gilev. Fora dos testes, os traços para o teste sintético (o primeiro teste) e para todos os outros testes foram removidos. O primeiro teste consulta principalmente operações atômicas (inserir, atualizar, excluir e ler) e complexas (com referência a várias tabelas, além de criar, alterar e excluir tabelas no banco de dados) com diferentes quantidades de dados de processamento. Portanto, o teste sintético de Gilev pode ser considerado bastante objetivo para comparar o desempenho médio unificado de dois ambientes (incluindo DBMS) em relação um ao outro. Os próprios valores absolutos não dizem nada, mas a proporção de duas mídias diferentes é bastante objetiva.À custa de outros testes de Gilev. O rastreio mostra que o número máximo de encadeamentos foi 7, mas a conclusão sobre o número de usuários foi superior a 50. Além disso, por solicitação, não está totalmente claro como outros indicadores são calculados. Portanto, o restante dos testes não é objetivo e é extremamente variado e aproximado. Somente testes especializados, levando em consideração as especificidades não apenas do sistema, mas também do trabalho dos próprios usuários, fornecerão valores mais precisos.Agradecimentos
- executou a configuração do 1C e lançou os testes de Gilev e também fez uma contribuição significativa para a criação desta publicação:
- Roman Buts - líder da equipe 1C
- Alexander Gryaznov - programador 1C
- Colegas do Fortis que fizeram uma contribuição significativa para a otimização de ajuste do CentOS, PostgreSQL etc., mas desejavam permanecer incógnitos
Agradecimentos especiais também ao uaggster e BP1988 por alguns conselhos sobre o MS SQL e o Windows.Posfácio
Também uma análise curiosa foi feita neste artigo .E que resultados você teve e como testou?Fontes