D3.js是一个JavaScript库,用于根据输入数据来处理文档。 Angular是一个拥有高性能数据绑定的框架。
下面,我将探讨一种利用所有这些功能的好方法。 从D3模拟到SVG注入以及模板语法的使用。
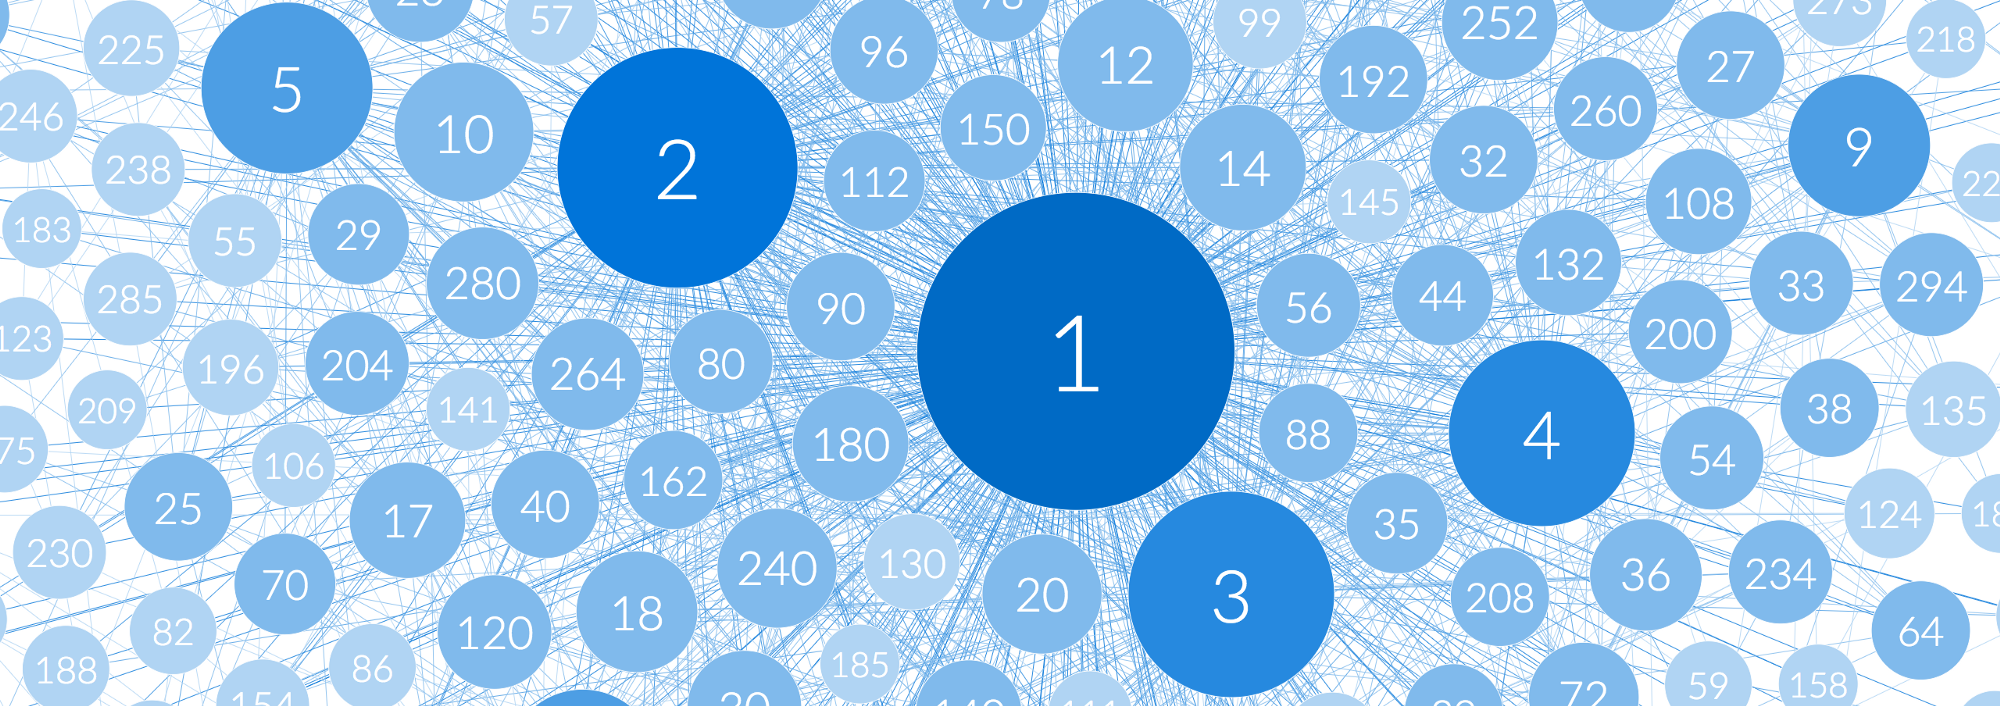 演示:与除数相关的正数(最多300)。
对于不会阅读本文的kulhacker,下面是带有示例代码的库链接。 对于所有其他中农(当然不是您),本文中的代码经过简化以提高可读性。
源代码 (最近更新到Angular 5)
演示版如何轻松制作如此酷的nishtyaki
下面,我将介绍一种使用Angular + D3的方法。 我们将执行以下步骤:
- 项目初始化
- 创建Ang的d3接口
- 模拟生成
- 通过角度将模拟数据绑定到文档
- 将用户交互绑定到图形
- 通过变更检测实现性能优化
- 发布和抱怨角度版本控制策略
因此,打开您的终端,启动代码编辑器,并且别忘了抬起剪贴板,我们开始沉浸在代码中。
应用结构
我们将分离与d3和svg相关的代码。 我将更详细地描述何时将创建必要的文件,但是现在,这是我们将来的应用程序的结构:
d3 |- models |- directives |- d3.service.ts visuals |- graph |- shared
初始化Angular应用程序
启动Angular应用程序项目。 Angular 5、4或2我们的代码已在所有三个版本上进行了测试。
如果您还没有angular-cli,请快速安装
npm install -g @angular/cli
然后生成一个新项目:
ng new angular-d3-example
您的应用程序将在
angular-d3-example文件夹中创建。 从此目录的根目录运行
ng serve命令,该应用程序将在
localhost:4200可用。
初始化D3
记住要安装及其TypeSctipt广告。
npm install --save d3 npm install --save-dev @types/d3
创建Ang的d3接口
为了在框架内正确使用d3(或其他任何库),最好通过自定义接口进行交互,该接口是我们通过类,角度服务和指令定义的。 为此,我们将主要功能与使用它的组件分开。 这将使我们的应用程序结构更加灵活和可扩展,并隔离错误。
我们的D3文件夹将具有以下结构:
d3 |- models |- directives |- d3.service.ts
models将提供类型安全性并提供基准对象。
directives将告诉元素如何使用d3功能。
d3.service.ts将提供使用d3模型,指令以及应用程序外部组件的所有方法。
该服务将包含计算模型和行为。
getForceDirectedGraph方法将返回有向图的实例。
applyZoomableBehaviour和
applyDraggableBehaviour允许您将用户交互与其各自的行为相关联。
// path : d3/d3.service.ts import { Injectable } from '@angular/core'; import * as d3 from 'd3'; @Injectable() export class D3Service { constructor() {} applyZoomableBehaviour() {} applyDraggableBehaviour() {} getForceDirectedGraph() {} }
定向图
我们继续创建一类面向图和相关模型。 我们的图由节点和链接组成,让我们定义相应的模型。
// path : d3/models/index.ts export * from './node'; export * from './link'; // To be implemented in the next gist export * from './force-directed-graph';
// path : d3/models/link.ts import { Node } from './'; // Implementing SimulationLinkDatum interface into our custom Link class export class Link implements d3.SimulationLinkDatum<Node> { // Optional - defining optional implementation properties - required for relevant typing assistance index?: number; // Must - defining enforced implementation properties source: Node | string | number; target: Node | string | number; constructor(source, target) { this.source = source; this.target = target; } }
// path : d3/models/node.ts // Implementing SimulationNodeDatum interface into our custom Node class export class Node extends d3.SimulationNodeDatum { // Optional - defining optional implementation properties - required for relevant typing assistance index?: number; x?: number; y?: number; vx?: number; vy?: number; fx?: number | null; fy?: number | null; id: string; constructor(id) { this.id = id; } }
在将主要模型声明为图操作之后,让我们声明图本身的模型。
// path : d3/models/force-directed-graph.ts import { EventEmitter } from '@angular/core'; import { Link } from './link'; import { Node } from './node'; import * as d3 from 'd3'; const FORCES = { LINKS: 1 / 50, COLLISION: 1, CHARGE: -1 } export class ForceDirectedGraph { public ticker: EventEmitter<d3.Simulation<Node, Link>> = new EventEmitter(); public simulation: d3.Simulation<any, any>; public nodes: Node[] = []; public links: Link[] = []; constructor(nodes, links, options: { width, height }) { this.nodes = nodes; this.links = links; this.initSimulation(options); } initNodes() { if (!this.simulation) { throw new Error('simulation was not initialized yet'); } this.simulation.nodes(this.nodes); } initLinks() { if (!this.simulation) { throw new Error('simulation was not initialized yet'); } // Initializing the links force simulation this.simulation.force('links', d3.forceLink(this.links) .strength(FORCES.LINKS) ); } initSimulation(options) { if (!options || !options.width || !options.height) { throw new Error('missing options when initializing simulation'); } if (!this.simulation) { const ticker = this.ticker; // Creating the force simulation and defining the charges this.simulation = d3.forceSimulation() .force("charge", d3.forceManyBody() .strength(FORCES.CHARGE) ); // Connecting the d3 ticker to an angular event emitter this.simulation.on('tick', function () { ticker.emit(this); }); this.initNodes(); this.initLinks(); } this.simulation.force("centers", d3.forceCenter(options.width / 2, options.height / 2)); this.simulation.restart(); } }
由于已经定义了模型,因此我们还要更新
getForceDirectedGraph中的
getForceDirectedGraph方法
getForceDirectedGraph(nodes: Node[], links: Link[], options: { width, height} ) { let graph = new ForceDirectedGraph(nodes, links, options); return graph; }
创建
ForceDirectedGraph的实例将返回下一个对象
ForceDirectedGraph { ticker: EventEmitter, simulation: Object }
该对象包含带有我们传递的数据的
simulation属性,以及包含对模拟的每个刻度触发的事件发射器的
ticker属性。 这是我们将如何使用它:
graph.ticker.subscribe((simulation) => {});
D3Service类的其余方法
D3Service在稍后定义,但是现在,我们将尝试将
simulation对象的数据绑定到文档。
模拟绑定
我们有一个ForceDirectedGraph对象的实例,它包含顶点(节点)和弧(链接)的不断更新的数据。 您可以将此数据绑定到类似d3的文档(例如野蛮人):
function ticked() { node .attr("cx", function(d) { return dx; }) .attr("cy", function(d) { return dy; }); }<source> , 21 , , . Angular . <h3><i>: SVG Angular</i></h3> <h3>SVG Angular</h3> SVG, svg html . Angular SVG Angular ( <code>svg</code>). SVG : <ol> <li> <code>svg</code>.</li> <li> “svg”, Angular', <code><svg:line></code></li> </ol> <source lang="xml"> <svg> <line x1="0" y1="0" x2="100" y2="100"></line> </svg>
app.component.html
<svg:line x1="0" y1="0" x2="100" y2="100"></svg:line>
link-example.component.html
Angular中的SVG组件
将选择器分配给SVG名称空间中的组件将无法正常工作。 它们只能通过属性选择器应用。
<svg> <g [lineExample]></g> </svg>
app.component.html
import { Component } from '@angular/core'; @Component({ selector: '[lineExample]', template: `<svg:line x1="0" y1="0" x2="100" y2="100"></svg:line>` }) export class LineExampleComponent { constructor() {} }
link-example.component.ts
注意组件模板中的svg前缀杂耍结束
模拟绑定-可视部分
有了svg的古老知识,我们就可以开始创建可以模拟我们数据的组件。 将它们隔离在
visuals文件夹中之后,我们将创建
shared文件夹(将放置其他类型的图可以使用的组件)和主
graph文件夹,其中将包含显示定向图(强制定向图)所需的所有代码。
visuals |- graph |- shared
图形可视化
让我们创建我们的根组件,它将生成一个图形并将其绑定到文档。 我们通过组件的输入属性传递节点并链接到它。
<graph [nodes]="nodes" [links]="links"></graph>
该组件接受
nodes并
links属性,并实例化
ForceDirectedGraph类
// path : visuals/graph/graph.component.ts import { Component, Input } from '@angular/core'; import { D3Service, ForceDirectedGraph, Node } from '../../d3'; @Component({ selector: 'graph', template: ` <svg #svg [attr.width]="_options.width" [attr.height]="_options.height"> <g> <g [linkVisual]="link" *ngFor="let link of links"></g> <g [nodeVisual]="node" *ngFor="let node of nodes"></g> </g> </svg> `, styleUrls: ['./graph.component.css'] }) export class GraphComponent { @Input('nodes') nodes; @Input('links') links; graph: ForceDirectedGraph; constructor(private d3Service: D3Service) { } ngOnInit() { this.graph = this.d3Service.getForceDirectedGraph(this.nodes, this.links, this.options); } ngAfterViewInit() { this.graph.initSimulation(this.options); } private _options: { width, height } = { width: 800, height: 600 }; get options() { return this._options = { width: window.innerWidth, height: window.innerHeight }; } }
组件NodeVisual
接下来,让我们添加一个组件以渲染顶点(节点),它将显示一个带有顶点ID的圆。
// path : visuals/shared/node-visual.component.ts import { Component, Input } from '@angular/core'; import { Node } from '../../../d3'; @Component({ selector: '[nodeVisual]', template: ` <svg:g [attr.transform]="'translate(' + node.x + ',' + node.y + ')'"> <svg:circle cx="0" cy="0" r="50"> </svg:circle> <svg:text> {{node.id}} </svg:text> </svg:g> ` }) export class NodeVisualComponent { @Input('nodeVisual') node: Node; }
LinkVisual组件
这是可视化圆弧(链接)的组件:
// path : visuals/shared/link-visual.component.ts import { Component, Input } from '@angular/core'; import { Link } from '../../../d3'; @Component({ selector: '[linkVisual]', template: ` <svg:line [attr.x1]="link.source.x" [attr.y1]="link.source.y" [attr.x2]="link.target.x" [attr.y2]="link.target.y" ></svg:line> ` }) export class LinkVisualComponent { @Input('linkVisual') link: Link; }
行为举止
让我们回到应用程序的d3部分,开始为服务创建指令和方法,这将为我们提供与图形交互的不错方法。
行为-缩放
添加缩放功能的绑定,以便以后可以轻松使用它:
<svg #svg> <g [zoomableOf]="svg"></g> </svg>
// path : d3/d3.service.ts // ... export class D3Service { applyZoomableBehaviour(svgElement, containerElement) { let svg, container, zoomed, zoom; svg = d3.select(svgElement); container = d3.select(containerElement); zoomed = () => { const transform = d3.event.transform; container.attr("transform", "translate(" + transform.x + "," + transform.y + ") scale(" + transform.k + ")"); } zoom = d3.zoom().on("zoom", zoomed); svg.call(zoom); } // ... }
// path : d3/directives/zoomable.directive.ts import { Directive, Input, ElementRef } from '@angular/core'; import { D3Service } from '../d3.service'; @Directive({ selector: '[zoomableOf]' }) export class ZoomableDirective { @Input('zoomableOf') zoomableOf: ElementRef; constructor(private d3Service: D3Service, private _element: ElementRef) {} ngOnInit() { this.d3Service.applyZoomableBehaviour(this.zoomableOf, this._element.nativeElement); } }
行为-拖放
要添加拖放,我们需要访问模拟对象,以便我们可以在拖动时暂停绘图。
<svg #svg> <g [zoomableOf]="svg"> <g [nodeVisual]="node" *ngFor="let node of nodes" [draggableNode]="node" [draggableInGraph]="graph"> </g> </g> </svg>
// path : d3/d3.service.ts // ... export class D3Service { applyDraggableBehaviour(element, node: Node, graph: ForceDirectedGraph) { const d3element = d3.select(element); function started() { /** Preventing propagation of dragstart to parent elements */ d3.event.sourceEvent.stopPropagation(); if (!d3.event.active) { graph.simulation.alphaTarget(0.3).restart(); } d3.event.on("drag", dragged).on("end", ended); function dragged() { node.fx = d3.event.x; node.fy = d3.event.y; } function ended() { if (!d3.event.active) { graph.simulation.alphaTarget(0); } node.fx = null; node.fy = null; } } d3element.call(d3.drag() .on("start", started)); } // ... }
// path : d3/directives/draggable.directives.ts import { Directive, Input, ElementRef } from '@angular/core'; import { Node, ForceDirectedGraph } from '../models'; import { D3Service } from '../d3.service'; @Directive({ selector: '[draggableNode]' }) export class DraggableDirective { @Input('draggableNode') draggableNode: Node; @Input('draggableInGraph') draggableInGraph: ForceDirectedGraph; constructor(private d3Service: D3Service, private _element: ElementRef) { } ngOnInit() { this.d3Service.applyDraggableBehaviour(this._element.nativeElement, this.draggableNode, this.draggableInGraph); } }
因此,我们最终拥有:
- 通过D3进行图形生成和仿真
- 使用Angular将模拟数据绑定到文档
- 用户通过d3与图进行交互
您现在可能会想:“我的仿真数据在不断变化,使用更改检测角度不断地将此数据更改为文档,但是为什么要这样做,我想在每次仿真时更新自己的图形。”
嗯,您部分正确,我将性能测试的结果与跟踪更改的不同机制进行了比较,结果发现,当私下应用更改时,我们可以获得很好的性能提升。
角度,D3和变更跟踪(变更检测)
我们将在onPush方法中设置更改跟踪(仅当完全替换到对象的链接时,才会跟踪更改)。
对顶点和圆弧对象的引用不会更改;因此,将不会跟踪更改。 太好了! 现在,我们可以控制更改跟踪并将其标记为在模拟的每个滴答处进行检查(使用我们安装的滴答器的事件发射器)。
import { Component, ChangeDetectorRef, ChangeDetectionStrategy } from '@angular/core'; @Component({ selector: 'graph', changeDetection: ChangeDetectionStrategy.OnPush, template: `<!-- svg, nodes and links visuals -->` }) export class GraphComponent { constructor(private ref: ChangeDetectorRef) { } ngOnInit() { this.graph = this.d3Service.getForceDirectedGraph(...); this.graph.ticker.subscribe((d) => { this.ref.markForCheck(); }); } }
现在,Angular将在每个刻度处更新图形,这就是我们需要的。
仅此而已!
您在本文中幸存下来,并创建了一个不错的可扩展可视化文件。 我希望一切都清楚而有用。 如果没有,请告诉我!
感谢您的阅读!
里兰·沙里尔