我建议阅读有关GraphQL实际应用的简短文章的免费翻译。 原稿在此处(
En )可用。
关于GraphQL的几句话
GraphQL是一种API查询语言,它提供了一种声明式方法来检索数据。 它允许客户仅从Web服务器请求必要的数据,仅此而已。 GraphQL由Facebook于2012年开发,至今仍受支持,而GraphQL开始被其他许多大型公司使用。 Yelp,Shopify和Github等。
使用REST API时,通常会将请求发送到多个地址,以获取应用程序中所有必需的数据。 GraphQL API允许您将整个请求发送到该地址,以准确指示您希望通过该请求接收什么数据。 因此,顺便说一句,当在缓慢的移动连接中使用时,GraphQL很棒。
API版本对于开发团队可能是头疼的事情。 使用GraphQL,您不必担心。 GraphQL允许您在GraphQL API中添加新的字段和类型(将在后面讨论),而不会影响现有查询,可以从API客户端中隐藏旧的和未使用的字段。 GraphQL API使用一个不断发展的版本,可为您的应用程序提供对新API实现的持续访问,并提供干净且易于维护的代码库。
先决条件
在开始之前,请确保已安装Node version 6和更早版本。 您可以使用以下命令检查版本:
node -v
如果未安装Node,请转到URL:
https :
//nodejs.org/并按照安装说明进行操作。
自定义GraphQL和Express
创建Graph API服务器的一种简单方法是使用Express,它是Node.js的流行框架。 使用npm安装Express:
npm init npm install express --save
然后安装`graphql`和`express-graphql`:
npm install graphql express-graphql --save
因此,该文件夹的初始结构如下:
|---- node_modules
|---- package.json
GraphQL API快速入门
在这一小节中,我们将尝试快速创建一个简单的GraphQL API。 这对于进一步的叙述很重要,因此您可以清楚地知道我们正在做什么,使用GraphQL创建的API的样子。 如果有些观点似乎很难理解,请不要担心,我们将返回它们。
所以现在我们要使用来自graphql的buildSchema对象来创建模式(schema)。 在我们的文件夹中创建一个example.js文件。
const express = require('express'); const { buildSchema } = require('graphql'); const graphqlHTTP = require('express-graphql'); let port = 3000; let schema = buildSchema(` type Query { postTitle: String, blogTitle: String } `); let root = { postTitle: () => { return 'Build a Simple GraphQL Server With Express and NodeJS'; }, blogTitle: () => { return 'scotch.io'; } }; const app = express(); app.use('/', graphqlHTTP({ schema: schema, rootValue: root, graphiql: true
现在,您可以在终端中运行`example.js`:
node example.js
现在在localhost:3000上,您可以发现GraphiQL。 它将允许您在浏览器中测试您的API。 它支持自动完成,并根据架构中可用的类型和字段为您做出假设。

现在让我们为`blogTitle`请求模式:

如此简单,您可以请求GraphQL API。
引言
现在您了解了GraphQL的工作原理,我们可以更深入地开始这个话题。
让我们从创建基于Express的GraphQL服务器开始。 现在,在我们的文件夹中,创建src文件夹,并在其中创建并保存schema.js文件。 该文件如下所示:
接下来,在src文件夹中创建data文件夹。 我们将在其中放置2个文件:“ authors.js”和“ posts.js”。
这些文件的内容很大,因此您无法
通过Github上或扰流板下方的
链接来获取它们。
authors.js const Authors = [ { id: '8dlx7ak38fd39dv79ad', name: 'Orinami Olatunji', twitterHandle: '@orinami_' }, { id: 'jd3kd03d0w9a0l35rh74', name: 'Ojima Udale', twitterHandle: '@uncooloj' }, { id: '0hy894hf0dlkfh9oinv', name: 'Xabi Alonso', twitterHandle: '@alonso' } ]; module.exports = Authors;
posts.js const Posts = [ {'id':'0176413761b289e6d64c2c14a758c1c7','author_id':'0hy894hf0dlkfh9oinv','author':'alonso', 'category':'meteor','body':'Most developers and companies use two different apps for the marketing website and for the app itself. Thus, they can update each of the apps without affecting the other. [Stripe](https://stripe.com/), [Digital Ocean](https://www.digitalocean.com/) and many other companies follow this technique. Most Meteor apps also do the same.\n\nSo, in a scenario like this, sometimes we need to show the login state of the app on the landing page too. For an example, see our Kadira home page (\u003chttps://kadira.io\u003e). If you are logged into the Kadira app (\u003chttps://ui.kadira.io\u003e), we show a button with "Open Kadira UI" on the home page, which replaces the login button.\n\n[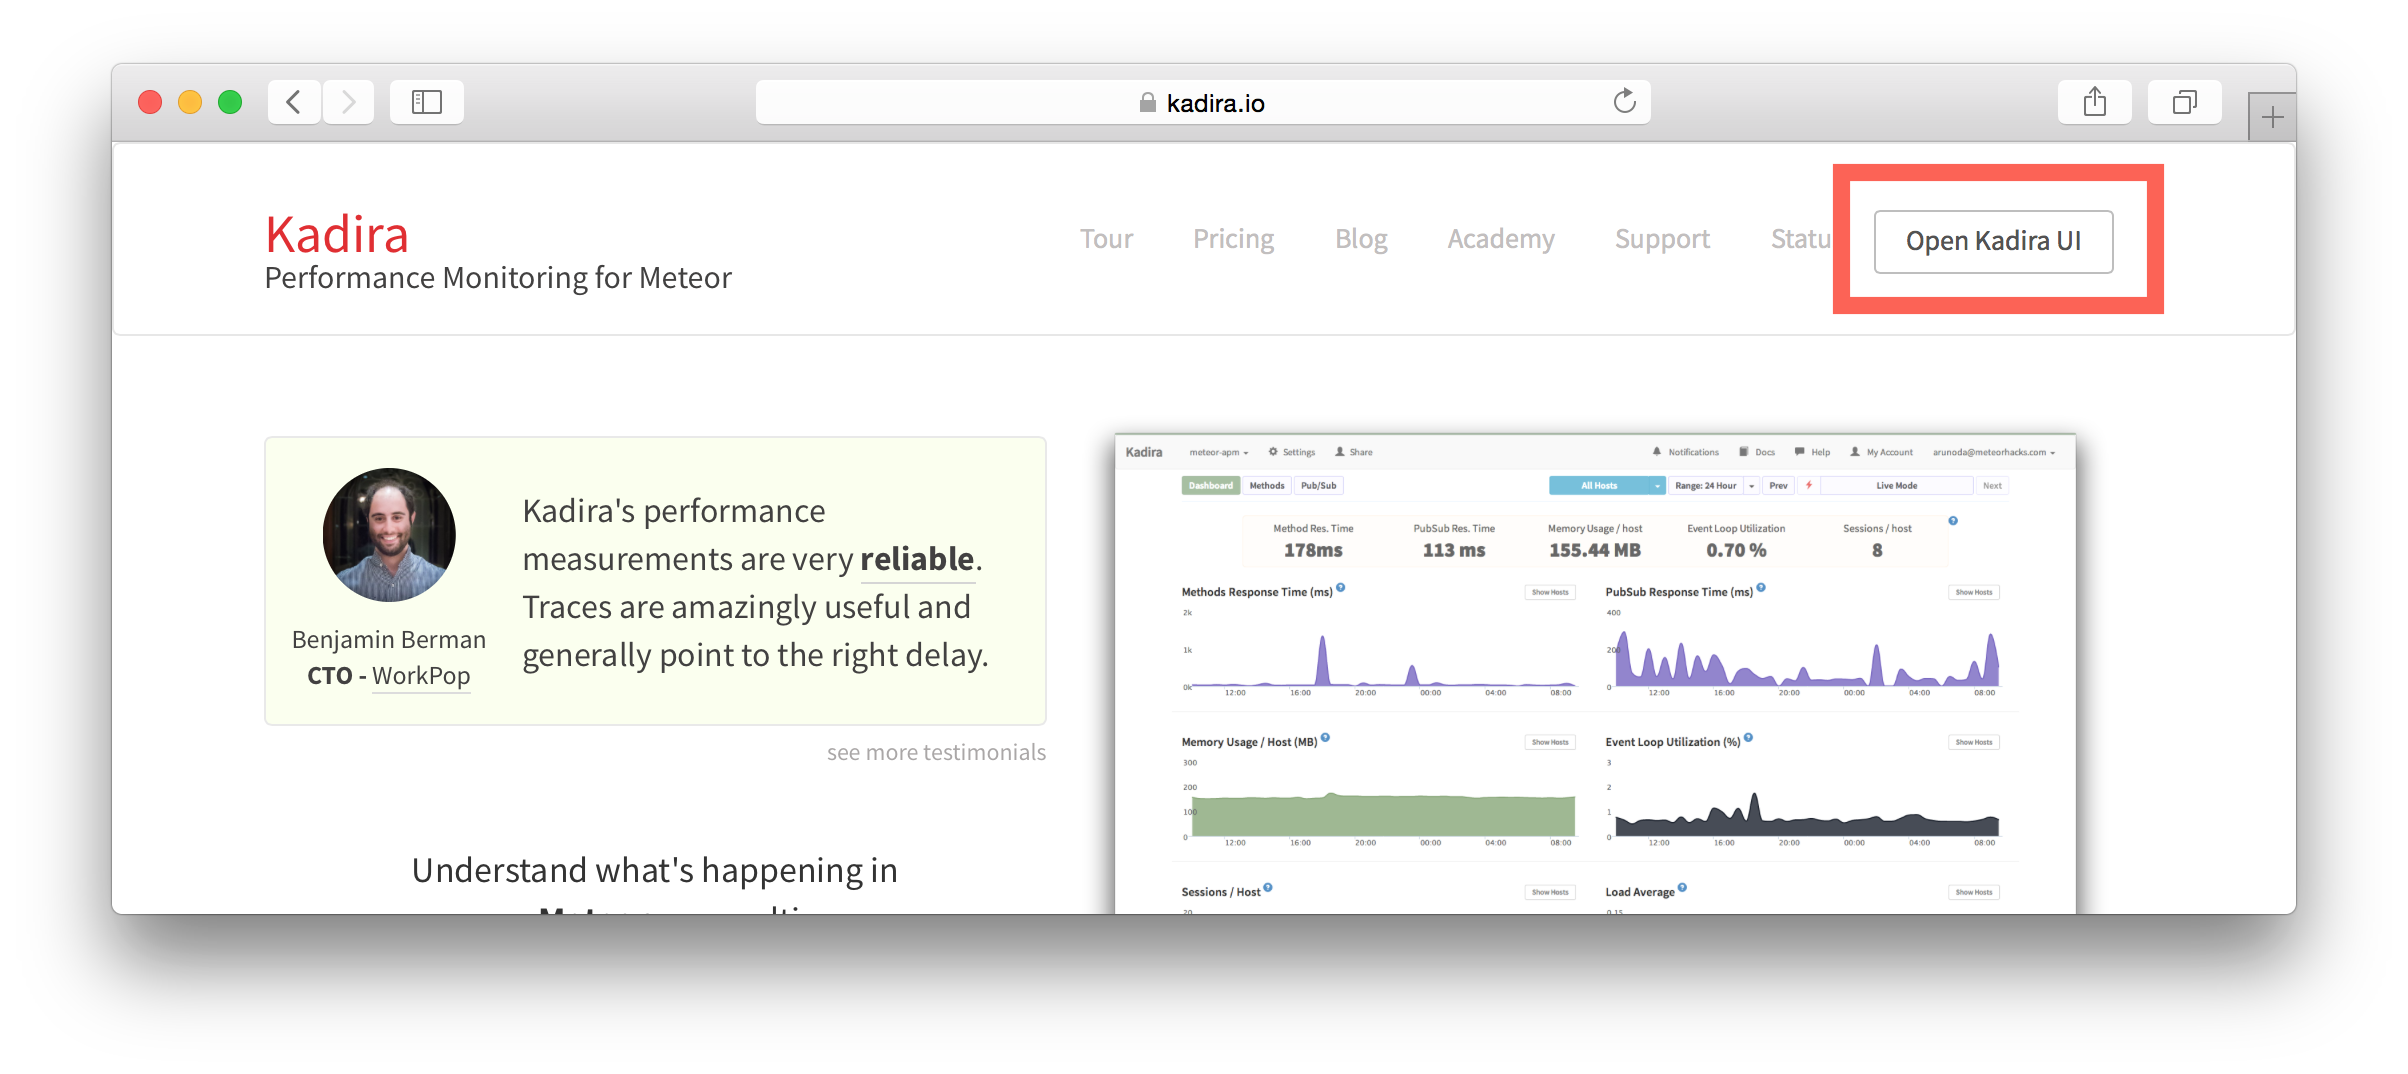](https://kadira.io)\n\n## How Did We Do It?\n\nMeteor does not have a built-in way to share login states across multiple apps or subdomains. So, we have to find an alternative way to do so.\n\nAs a solution, we can use browser cookies to share the login state between multiple domains. That\'s exactly what we did. We wrapped this up into a Meteor package, which now you can also use.\n\nIn this guide, I\'m going to explain how to share the login state between multiple domains using the [`kadira:login-state`](https://github.com/kadirahq/meteor-login-state) package.\n\n### On Meteor App\n\nFirst of all, install the `kadira:login-state` package in your Meteor app:\n\n~~~\nmeteor add kadira:login-state\n~~~\n\nThen, you need to add a new entry in the `public` object as the `loginState` in the `settings.json` file for your app. (If you haven\'t created the settings.json yet, you need to create it first.)\n\n~~~json\n{\n "public": {\n "loginState": {\n "domain": ".your-domain-name.com",\n "cookieName": "app-login-state-cookie-name"\n }\n }\n}\n~~~\n\nThe `domain` field must be your main domain name, starting with a dot. It allows you to share the login state, which can be accessed from any of its subdomains. You can use any appropriate identifier, such as `cookieName`.\n\nNow, everything has been set up on the Meteor app.\n\n### On the Static App (the Landing Page)\n\nNow we have to show the login state of the app on the landing page. For this, we need to add support for the login state for the static app (or landing page).\n\nActually, there are three different ways to do this. Here I will show you how to do so by pasting a few lines of JavaScript code.\n\nYou need to create a JavaScript file in your js folder. I create it as `js/login_state.js`. After that, copy and paste the following code snippet into it:\n\n~~~javascript\nLoginState = {};\n\nLoginState.get = function(cookieName) {\n var loginState = getCookie(cookieName);\n if(loginState) {\n return JSON.parse(decodeURIComponent(loginState));\n } else {\n return false;\n }\n};\n\nfunction getCookie(cname) {\n var name = cname + "=";\n var ca = document.cookie.split(\';\');\n for(var i=0; i \u003c ca.length; i++) {\n var c = ca[i];\n while (c.charAt(0)==\' \') c = c.substring(1);\n if (c.indexOf(name) != -1) return c.substring(name.length,c.length);\n }\n return;\n}\n~~~\n\nInsert that file into the head section of your HTML document: \n\n`\u003cscript src="js/login-state.js"\u003e\u003c/script\u003e`\n\n\u003e If you prefer, you can also use [Browserify](https://github.com/kadirahq/meteor-login-state#installing-via-browserify) or [Bower](https://github.com/kadirahq/meteor-login-state#installing-via-bower) to load the above JS file.\n\u003e The package name for both Browserify and Bower is `meteor-login-state`.\n\nThen, use the following code to get the login state of your app. You need to provide the relevant `cookieName` to do so: \n\n~~~javascript\nvar loginState = LoginState.get("app-login-state-cookie-name");\nif(loginState) {\n // the user has loggedIn to the meteor app\n // see the loginState Object for the addtional data\n // (append your code here!)\n console.log(loginState);\n} else {\n // user has not loggedIn yet.\n // (append your code here!) \n}\n~~~\n\nThe `loginState` object will be something like this:\n\n~~~json\n{\n timestamp: 1435835751489,\n username: "username",\n userId: "meteor-user-id",\n email: "user@email.com"\n url: "https://ui.kadira.io"\n}\n~~~\n\nNow you can do whatever you need to do with the login state.\n\nGive it a try and let me know what you think.','date':{'$date':'2015-07-07T00:00:00.000Z'},'layout':'blog_post','slug':'sharing-meteor-login-state-between-sub-domains','summary':'In this blog we\'ll show you how we shared login state between our static web app and our Meteor app Kadira UI.','title':'Sharing the Meteor Login State Between Subdomains'}, {'id':'03390abb5570ce03ae524397d215713b','author_id':'0hy894hf0dlkfh9oinv','author':'alonso', 'category':'product','body':'Here is a common feedback we received from our users:\n\n\u003e Hi, I have a suggestion. It would be great if I could "dismiss" errors or mark them as resolved on my end. This way, I can keep track of which errors I have resolved.\n\nToday we are happy to announce new Kadira feature which allows you to track **status** to errors. With that, you can mark errors as "Ignored", "Fixing" or "Fixed".\n\nOnce you mark an error as "Ignored", it will be hidden. \n\nBut you can click on "Show Ignored Errors" checkbox or filter by "ignored" status to view them again.\n\n\n\nYou can also filter errors by status like this:\n\n\n\nWe are rolling out this feature to all our paid users. [Give it a try](https://ui.kadira.io/apps/AUTO/errors/overview?metric=count).\n\n### What's next?\n\nRight now we are planning to add few more feature related this. Could you help us on [prioritizing](https:
GraphQL中的类型
GraphQL具有用于确定类型的模块“ grapql / type”。类型可以从模块'graphql / type'或从根模块'graphql'导入,基本类型包括ID,String,Int,Float和Boolean。我们还添加了作者类型。为此,请添加到我们的schema.js文件中: const AuthorType = new GraphQLObjectType({ name: "Author", description: "This represent an author", fields: () => ({ id: {type: new GraphQLNonNull(GraphQLString)}, name: {type: new GraphQLNonNull(GraphQLString)}, twitterHandle: {type: GraphQLString} }) });
如您所见,要添加新类型,我们需要:创建GraphQLObjectType类的对象并规定其某些属性。名称和描述-描述类型,字段定义类型Author的属性:id,name和twitterHandler。有关类型的更多详细信息,请访问graphql.org/graphql-js/type/现在让我们为帖子创建一个类型: const PostType = new GraphQLObjectType({ name: "Post", description: "This represent a Post", fields: () => ({ id: {type: new GraphQLNonNull(GraphQLString)}, title: {type: new GraphQLNonNull(GraphQLString)}, body: {type: GraphQLString}, author: { type: AuthorType, resolve: function(post) { return _.find(Authors, a => a.id == post.author_id); } } }) });
将此添加到schema.js。这将创建一个PostType对象,该对象将用于Root Query(实际上是root查询。实际上,是我们GraphQL API的入口点)。根根
根查询用于显示可用于应用程序客户端的资源。我们可以提供2种资源:作者和帖子。让我们添加到我们的`schema.js`文件中: const BlogQueryRootType = new GraphQLObjectType({ name: 'BlogAppSchema', description: "Blog Application Schema Query Root", fields: () => ({ authors: { type: new GraphQLList(AuthorType), description: "List of all Authors", resolve: function() { return Authors } }, posts: { type: new GraphQLList(PostType), description: "List of all Posts", resolve: function() { return Posts } } }) });
在这里,根查询定义为BlogQueryRootType。如果您注意到,这里已经声明了一个新类型:new GraphQLList()。它围绕其他类型创建包装,这些包装表示这些类型的列表。模式定义
该图定义了如何生成应用程序中的数据以及如何将数据相互连接。模式的定义会影响数据将如何存储在数据库中。在模式定义中,您还可以确定哪些查询,变异和订阅可用于您的数据显示界面。让我们向文件中添加一个模式: const BlogAppSchema = new GraphQLSchema({ query: BlogQueryRootType });
在此,为查询分配了BlogQueryRootType对象,该对象将用作根API请求。GraphQL API实现
我们需要`lodash`软件包。Lodash是一个Javascript工具包,它提供用于操作对象和集合的干净,高性能的方法。如果您熟悉下划线库,那就太好了!Lodash是通过添加其他功能并解决下划线性能问题而创建的。 npm install lodash --save
使用此命令,将安装lodash库,并将相应的依赖项添加到package.json文件。将以下代码添加到schema.js文件的顶部。 const _ = require('lodash');
现在,让我们看一下schema.js文件。这是文件最后的外观。 const _ = require('lodash');
如果您在PostType中注意到,我们还有一个额外的resolve属性。解析是一种可以处理数据,转换其值等的功能。并将它们返回到操作结束。将使用module.exports将BlogAppSchema导出到server.js文件,现在,在根文件夹中创建server.js文件,并添加以下代码: const express = require('express'); const graphqlHTTP = require('express-graphql'); const schema = require('./src/schema.js'); let port = 3000; const app = express(); app.use('/', graphqlHTTP({ schema: schema, graphiql: true })); app.listen(port); console.log('GraphQL API server running at localhost:'+ port);
现在在localhost上检查我们的结果:3000。为此,请打开终端并执行以下操作: node server.js
结果:
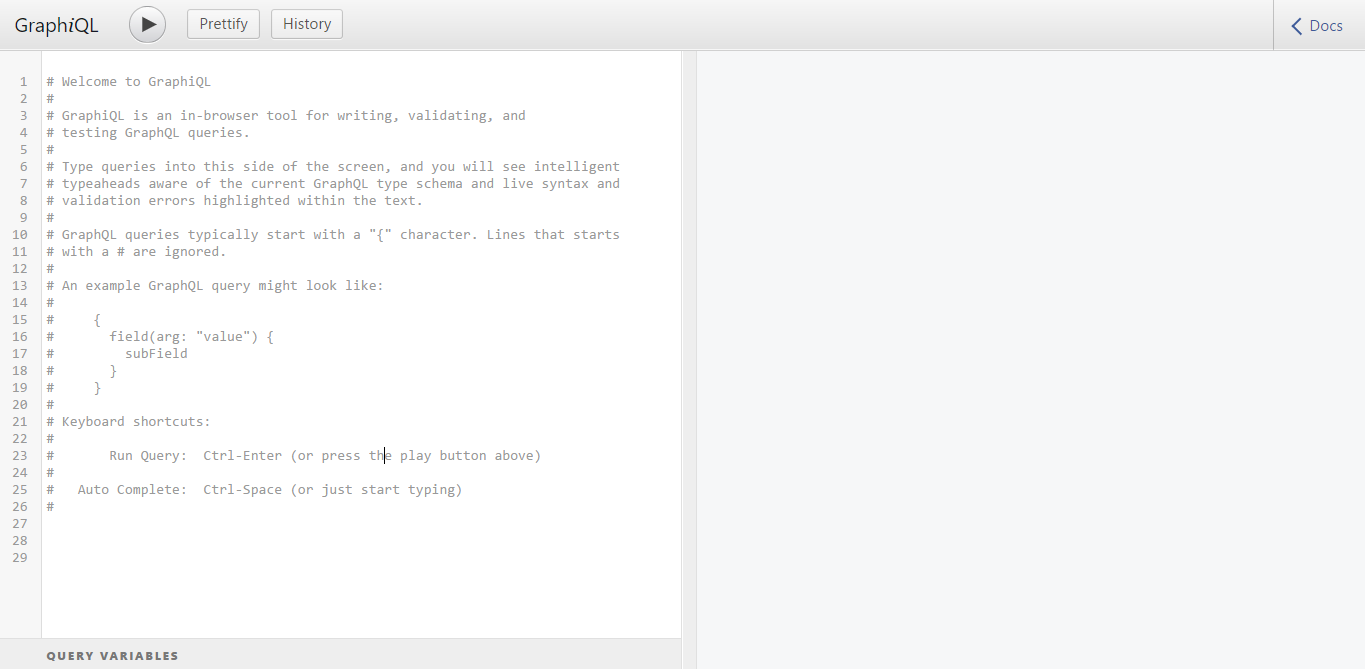 这是graphiql,它将帮助您在浏览器中测试API。所以下面的查询:
 { posts { id title author { name } } }
将给出这样的结果: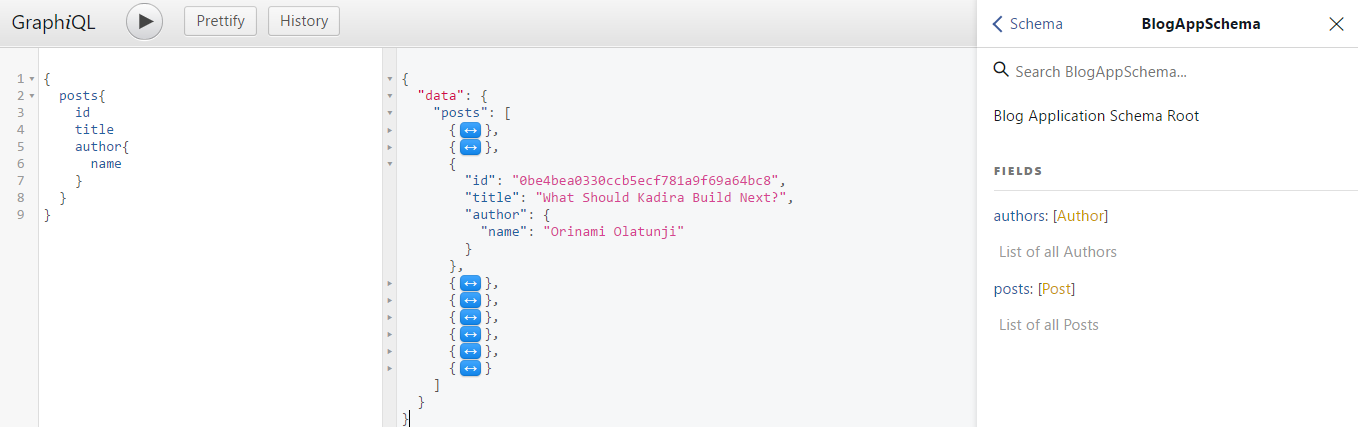
结论
我很高兴与您完成了本课。现在您知道了如何基于Express和NodeJS创建GraphQL API。我希望这堂课很有趣,并且您从中学到了很多。如果您想进一步了解GraphQL,请访问graphql.org。