私人空间发射的优势在于能够在项目实施的每个阶段为用户提供有关当前状况的可视数据,从而普及天文学和其他科学,并以普通人甚至儿童都可以理解的语言谈论科学成就和研究。 月亮又回来了!
以前,
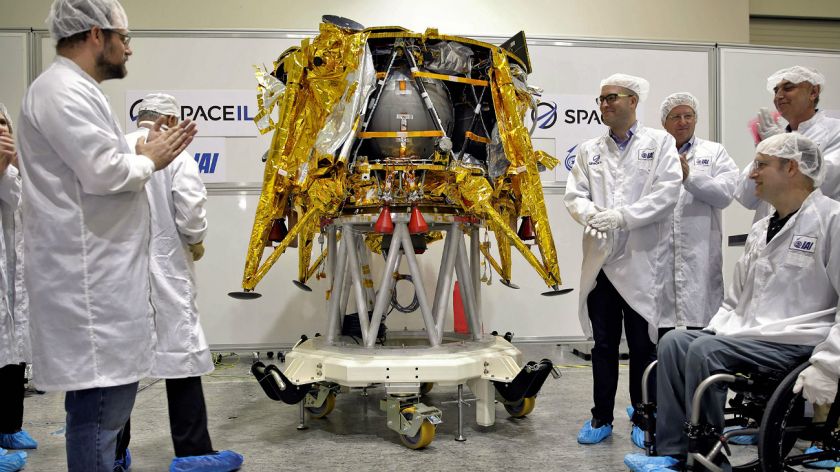
已经有关于由SpaceIL组织开发的成功启动Bereshit月球模块的出版物,主要由私人投资者提供支持,其中包括美国大亨谢尔登·阿德尔森和亿万富翁莫里斯·卡恩,他们也是最大的公司之一Amdocs(DOX)的联合创始人以色列公司。
在此处阅读有关
SpaceIL团队的
任务的信息 。
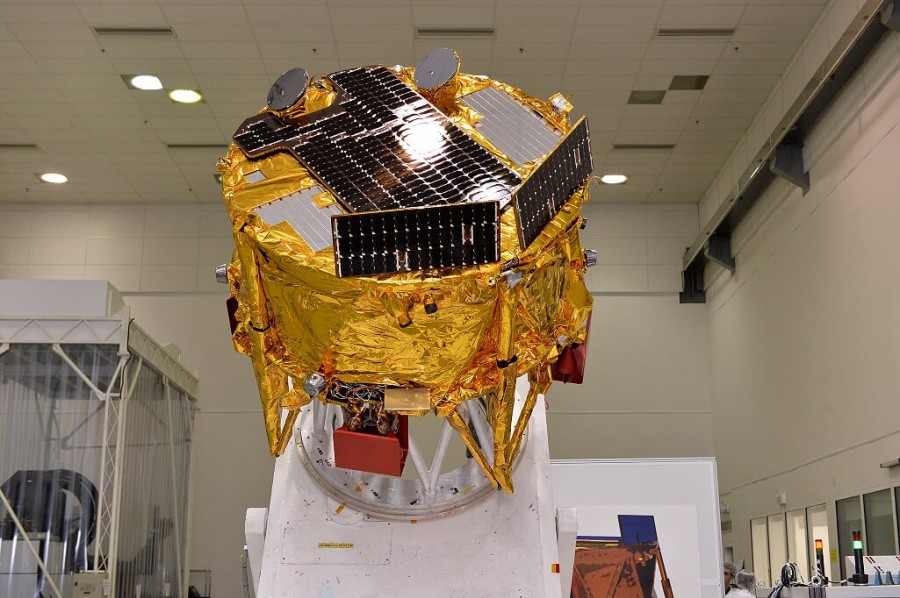
月球仪“ Bereshit”的特征:-高度约为1.5米;
-重量585公斤(含燃料)(燃油质量-390公斤),无燃料195公斤。
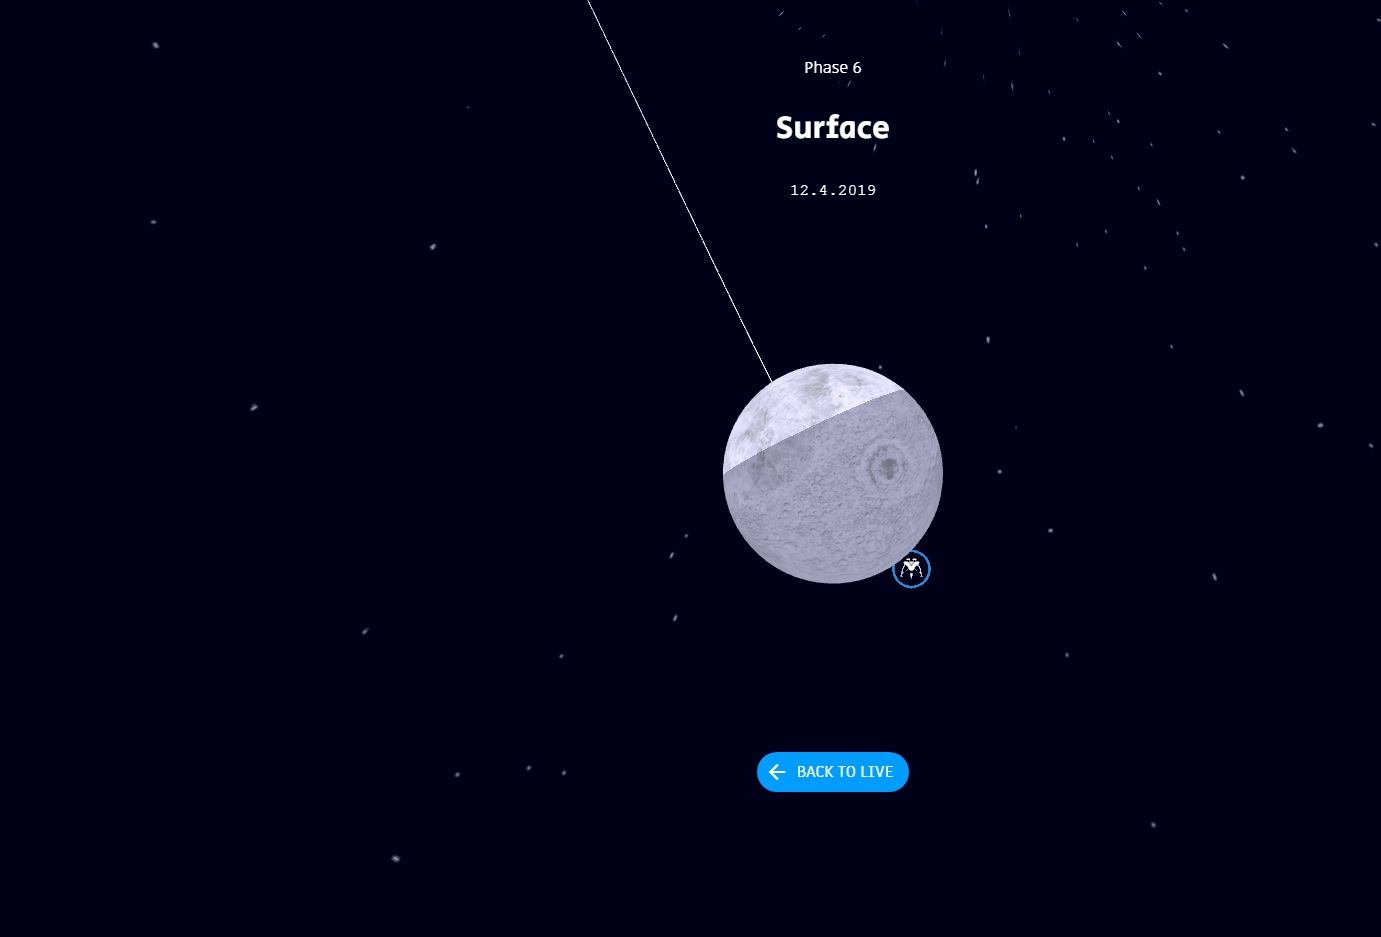
Bereshit设备没有热保护和冷却系统,估计在月球表面上的工作时间约为两天(最多三天),然后其电子设备和电池会因过热而失效,与该设备的连接将会丢失,并且它将变成新的清晰海中的月球纪念碑,毗邻Lunokhod-2(Luna-21任务)和Apollo 17任务模块。
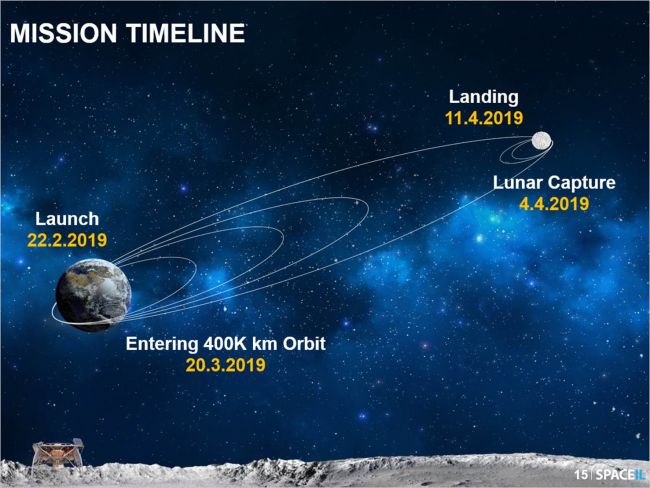
 Bereshit太空任务的阶段:
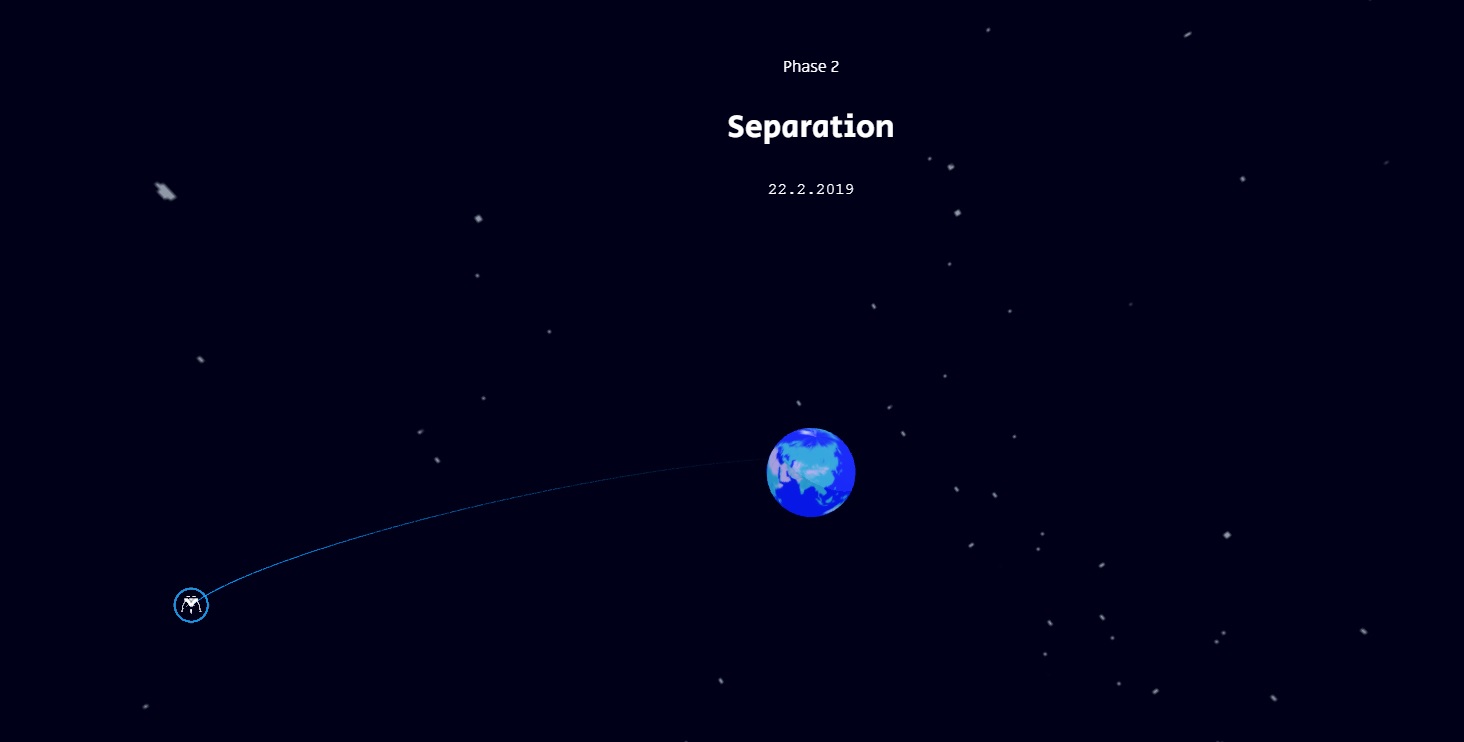
-2019年2月22日:从卡纳维拉尔角(佛罗里达州)的发射场在猎鹰9号运载火箭上发射;
-进入地球过渡轨道,进行一系列机动(打开发动机几秒钟),以增加绕地球的每个轨道之后其椭圆形内饰的最高点;
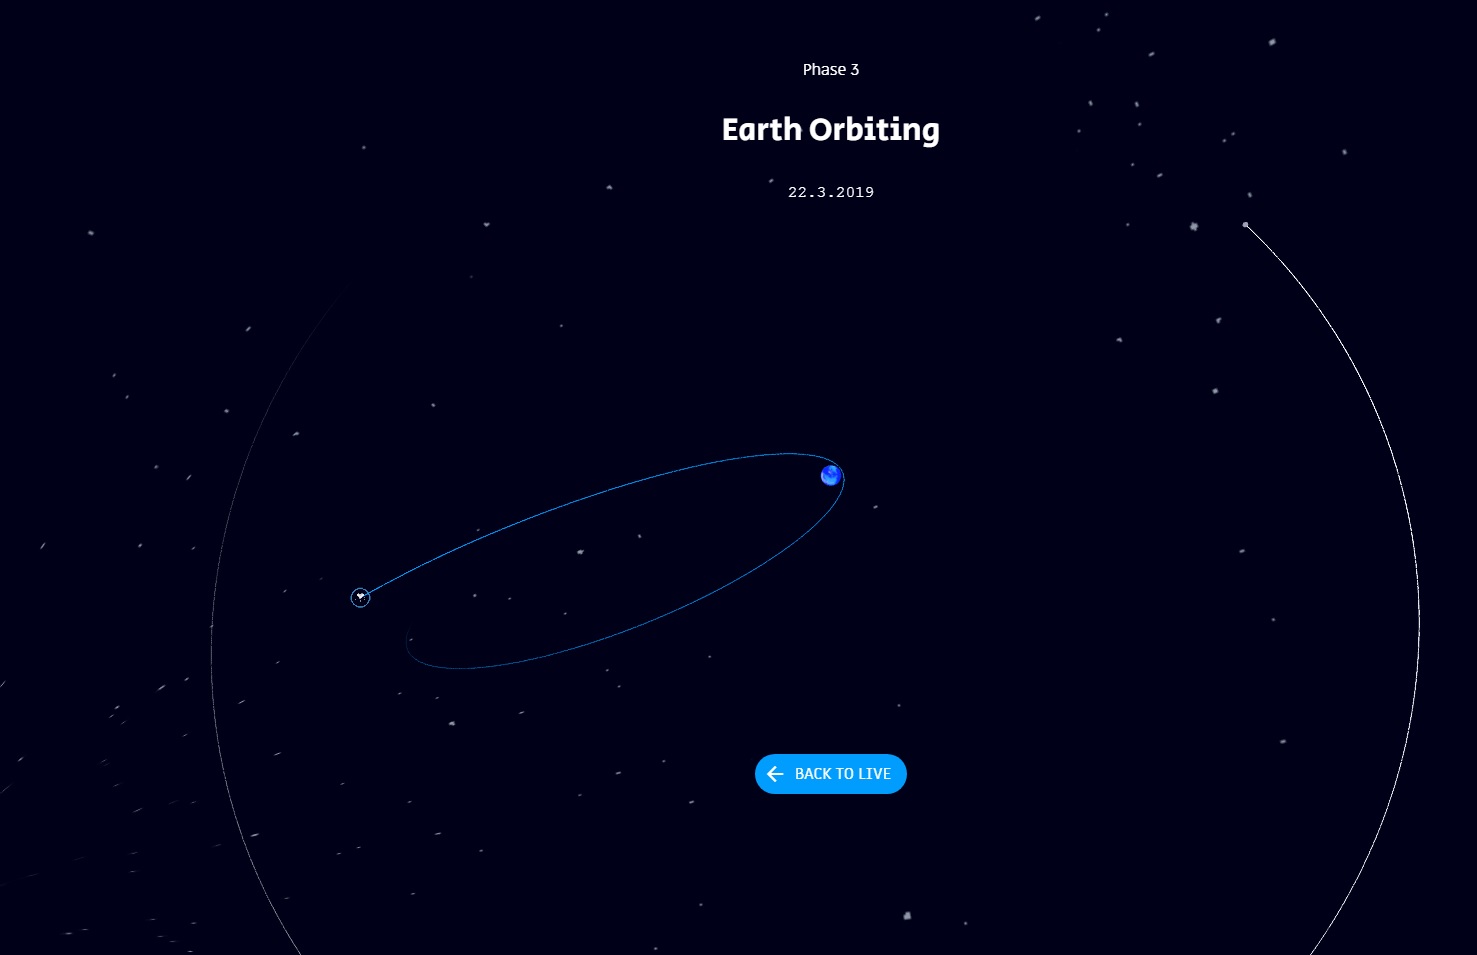
-2019年3月20日:以40万公里的最高点发射进入轨道;
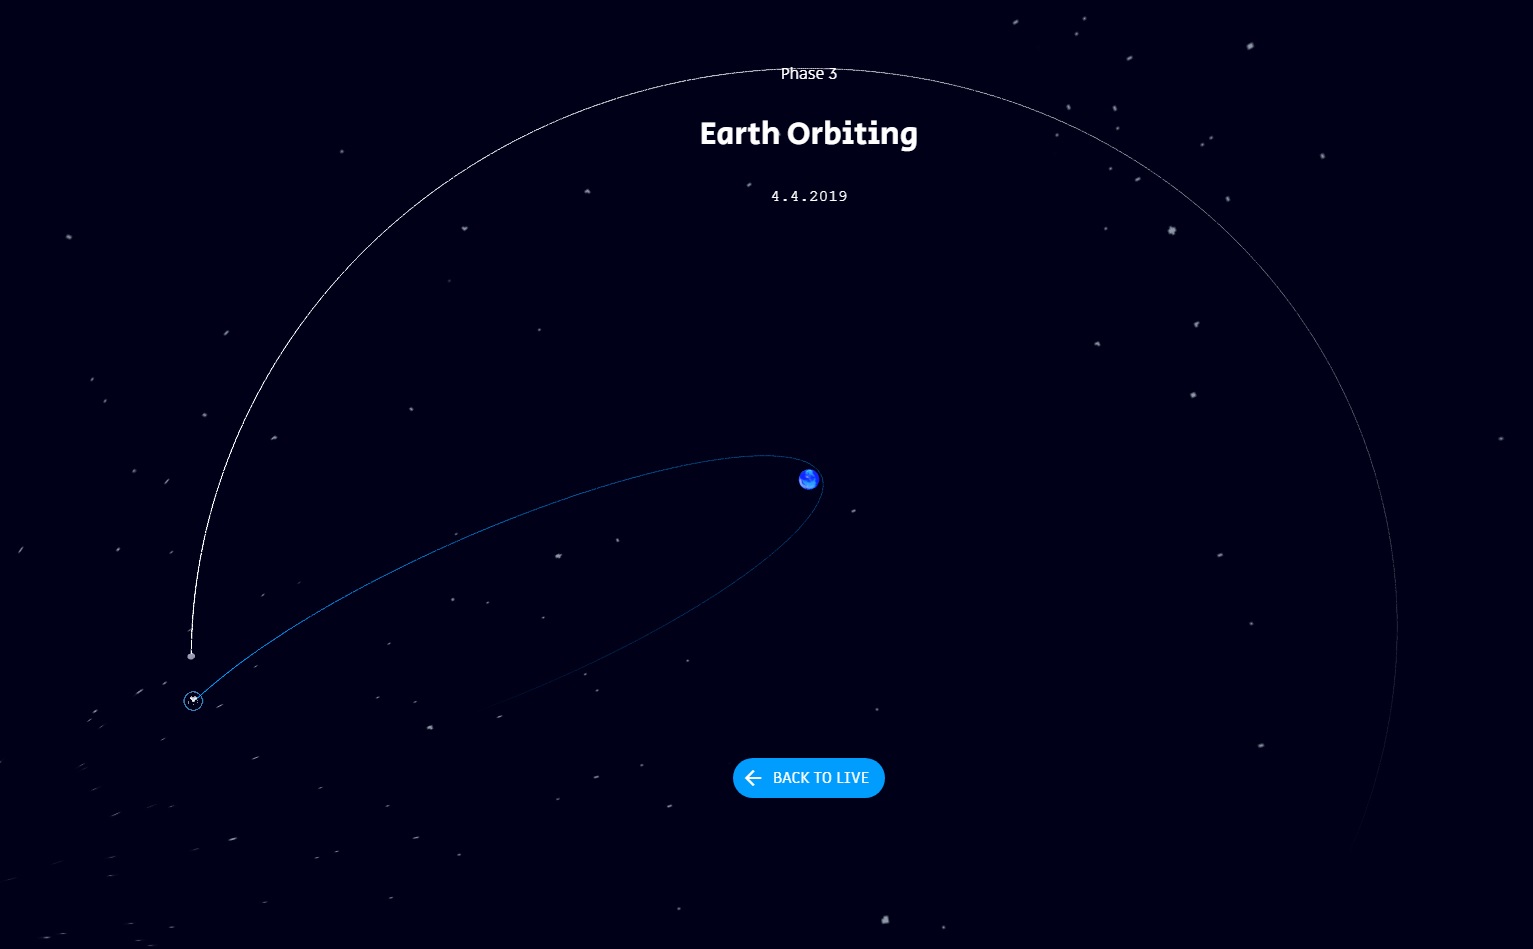
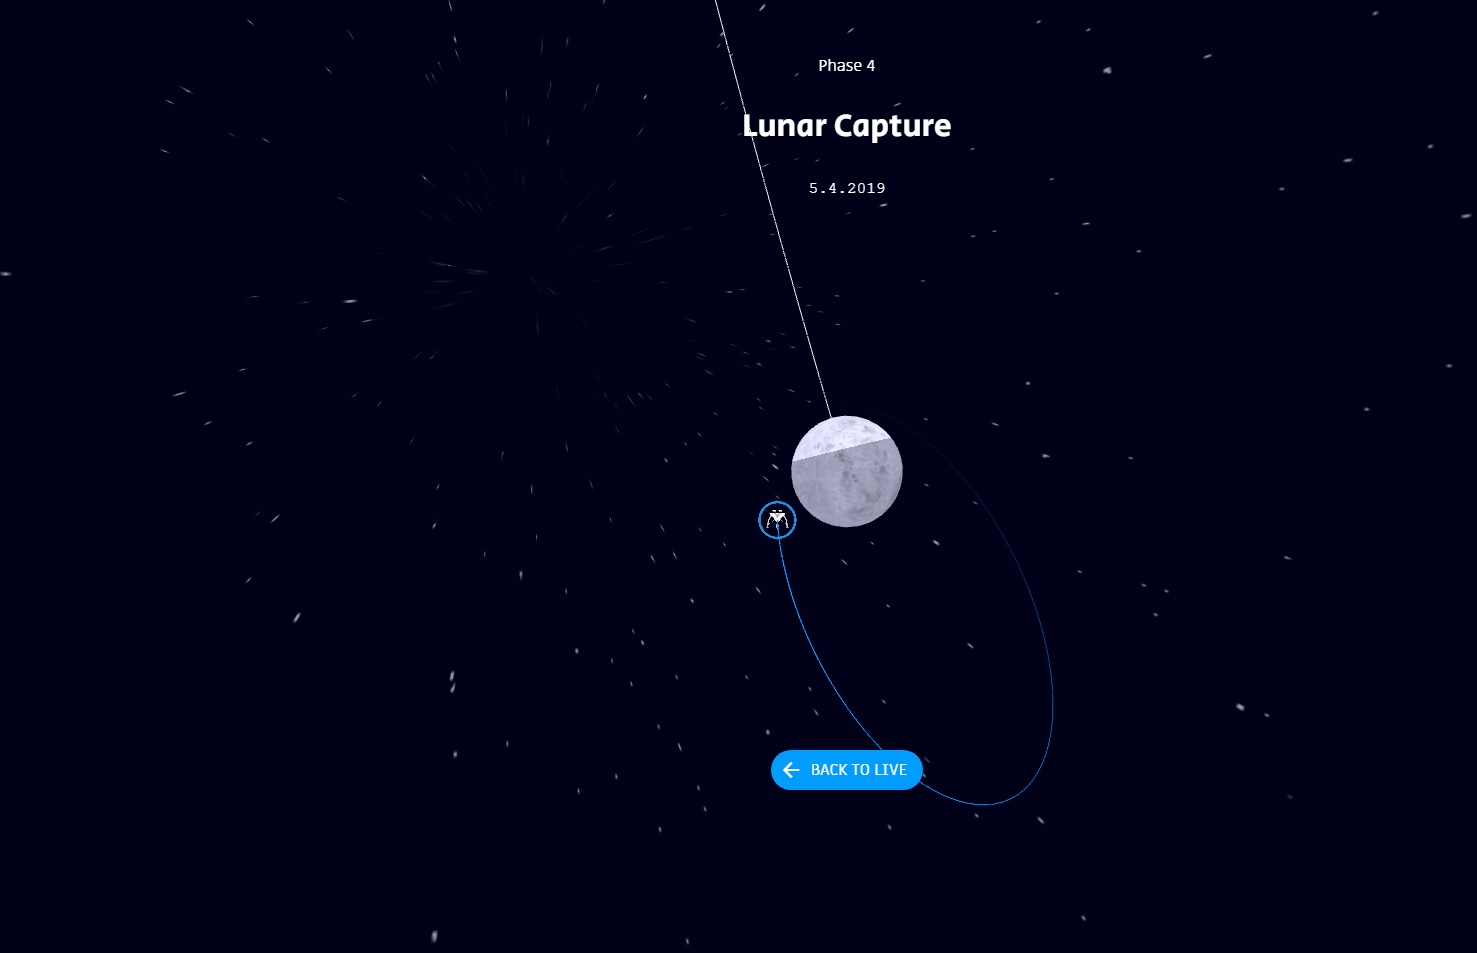
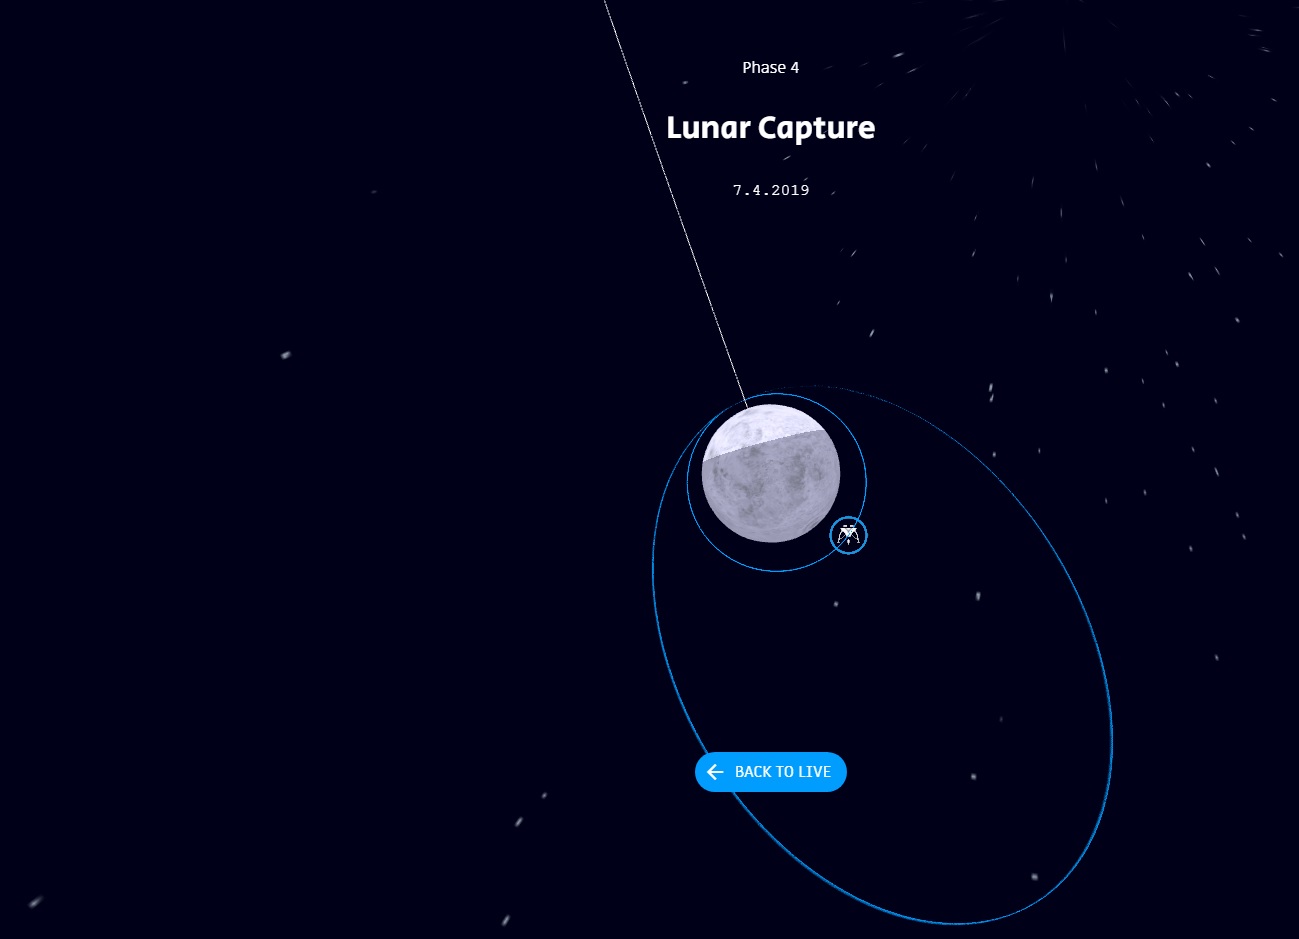
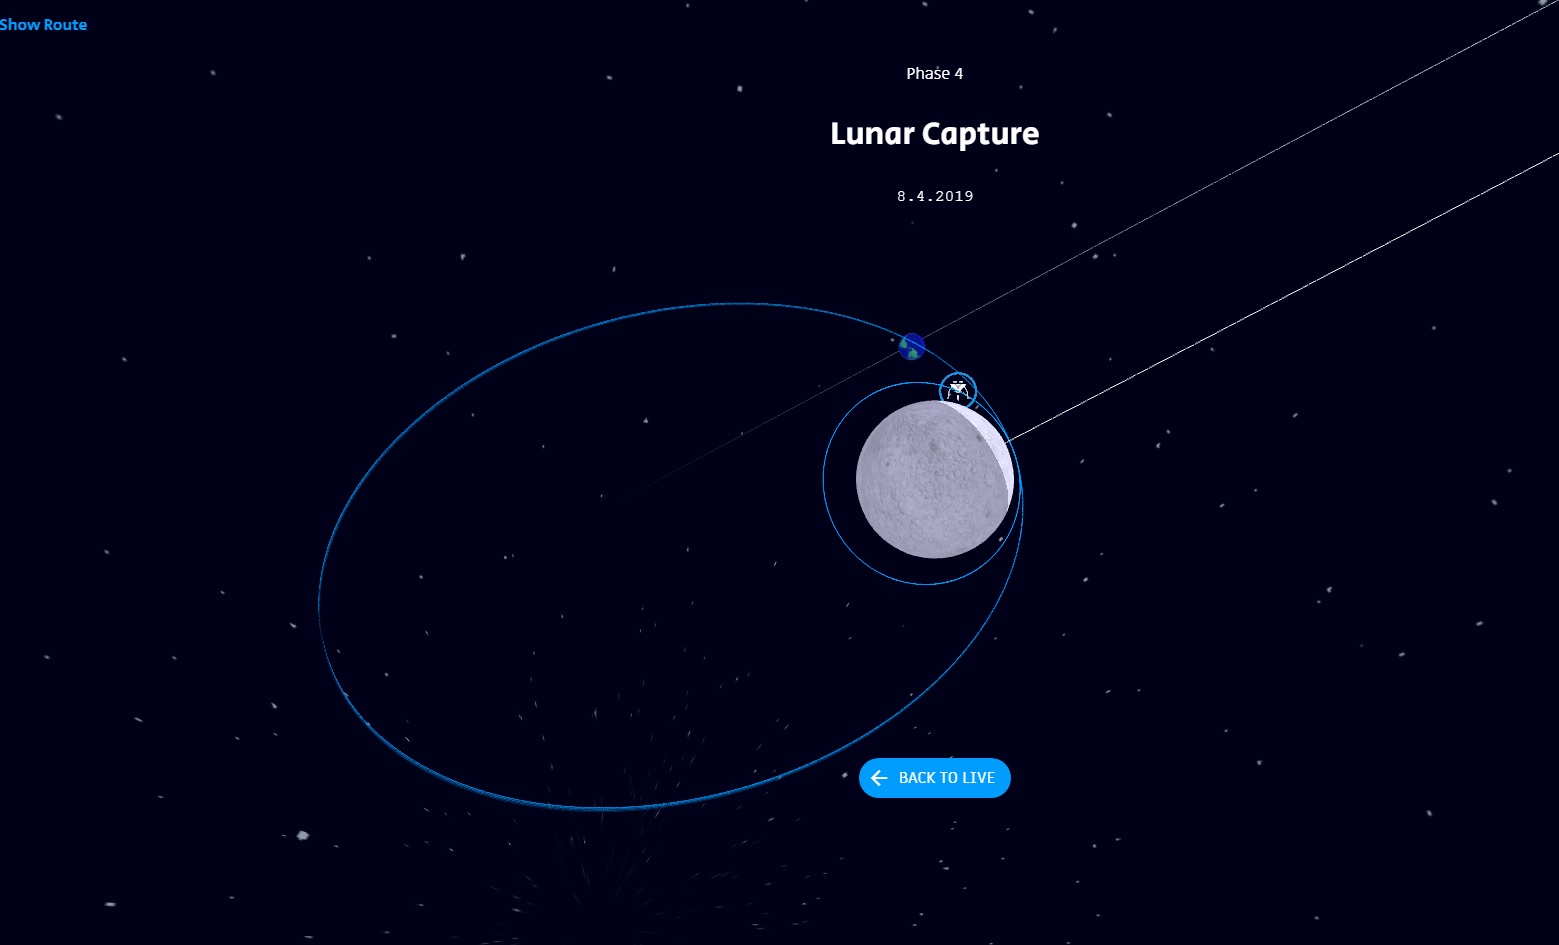
-2019年4月4日:进入月球轨道(被月球的引力场捕获);
-2019年4月11日:降落在月球表面的程序,“ Bereshit”降落将由LRO(美国宇航局的月球探测器)监视。
同时,“ Bereshit”如果成功,将打破一个奇特的记录-它沿着最长的轨迹飞向月球。
 “我们在距地球6.94万公里的距离上进行了首次成功的机动,打开了引擎30秒钟。 这是我们主机的第一个产品! 下次改正将于2月25日进行,” SpaceIL小组表示 。
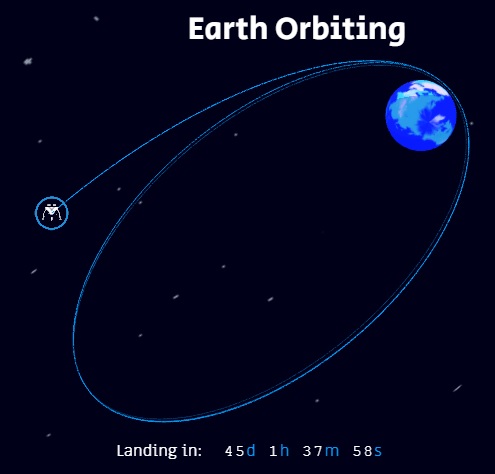 关于SpaceIL团队完成步骤的报告:
有关设备状态的报告在此处
以色列至月Twitter团队SpaceIL。
顺便说一句,根据SpaceIL的说法,在第一次演习中,引擎在高峰时开启了30秒,而不是按照先前的计划在近地点开启了30秒。
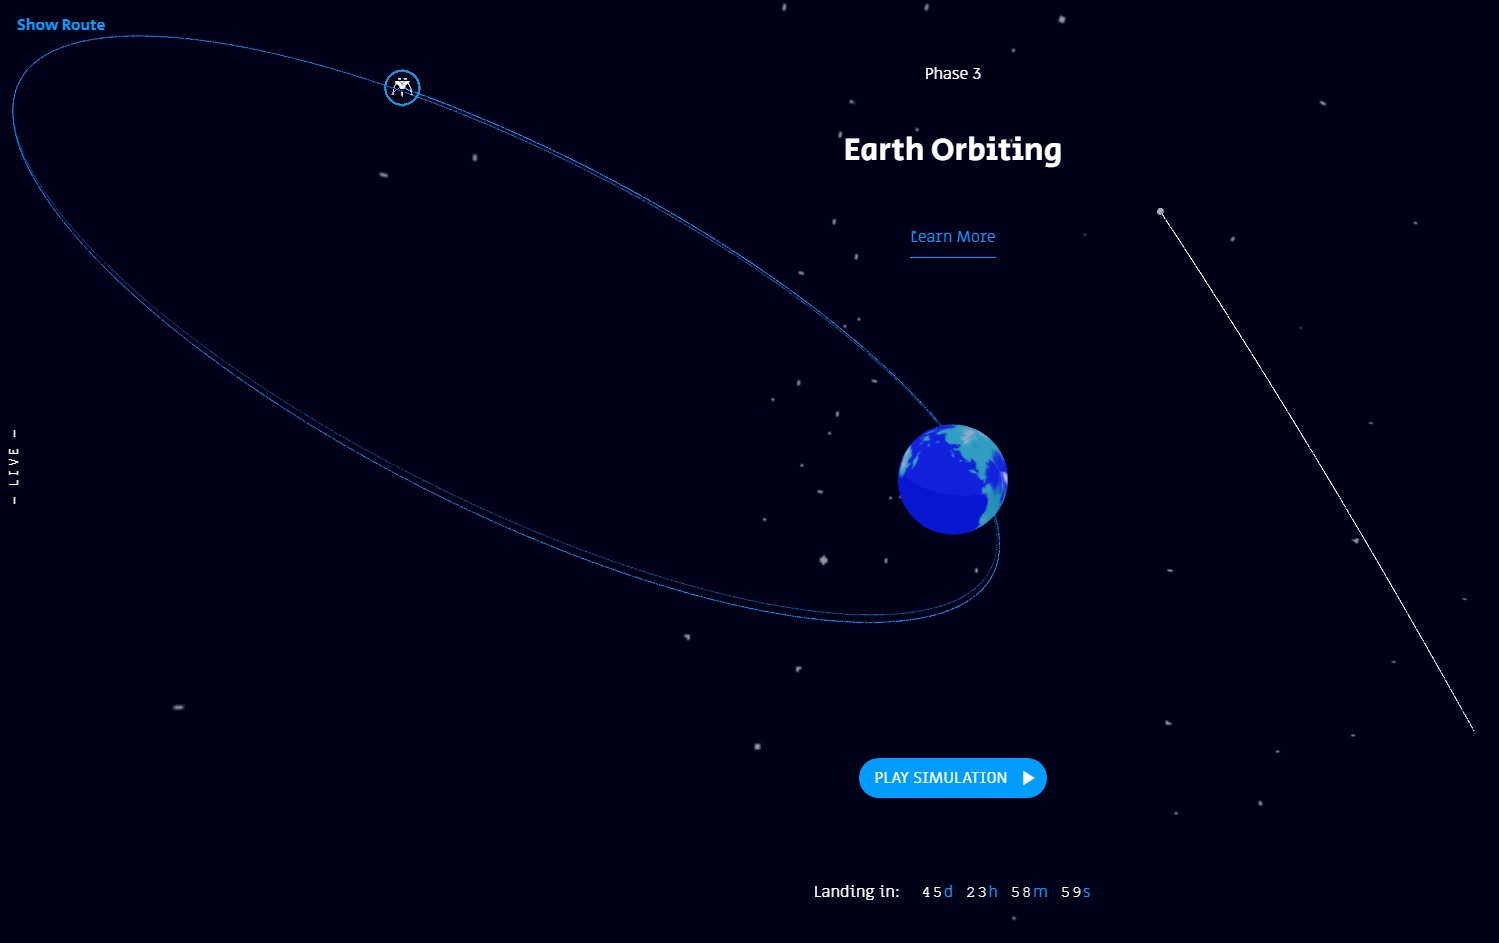
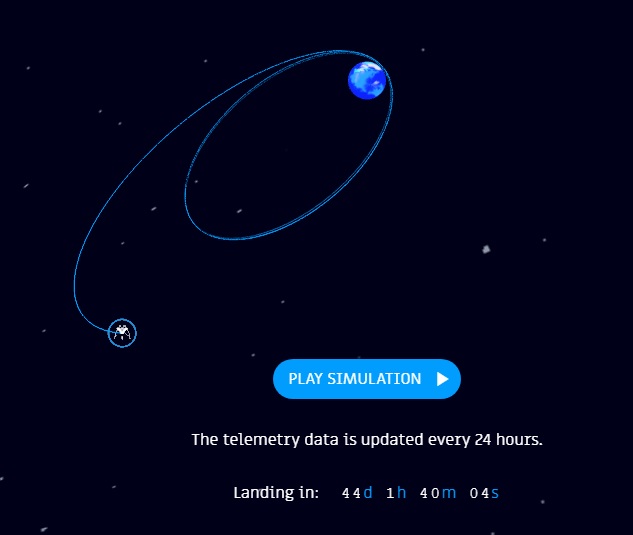
非营利组织SpaceIL为开放访问在线资源提供了模拟器和有关Bereshit任务当前状态的实时数据 。我们可以在此资源上找到:-Bereshit设备相对于地球和月球的当前视觉位置,包括剩余飞行时间的数据:
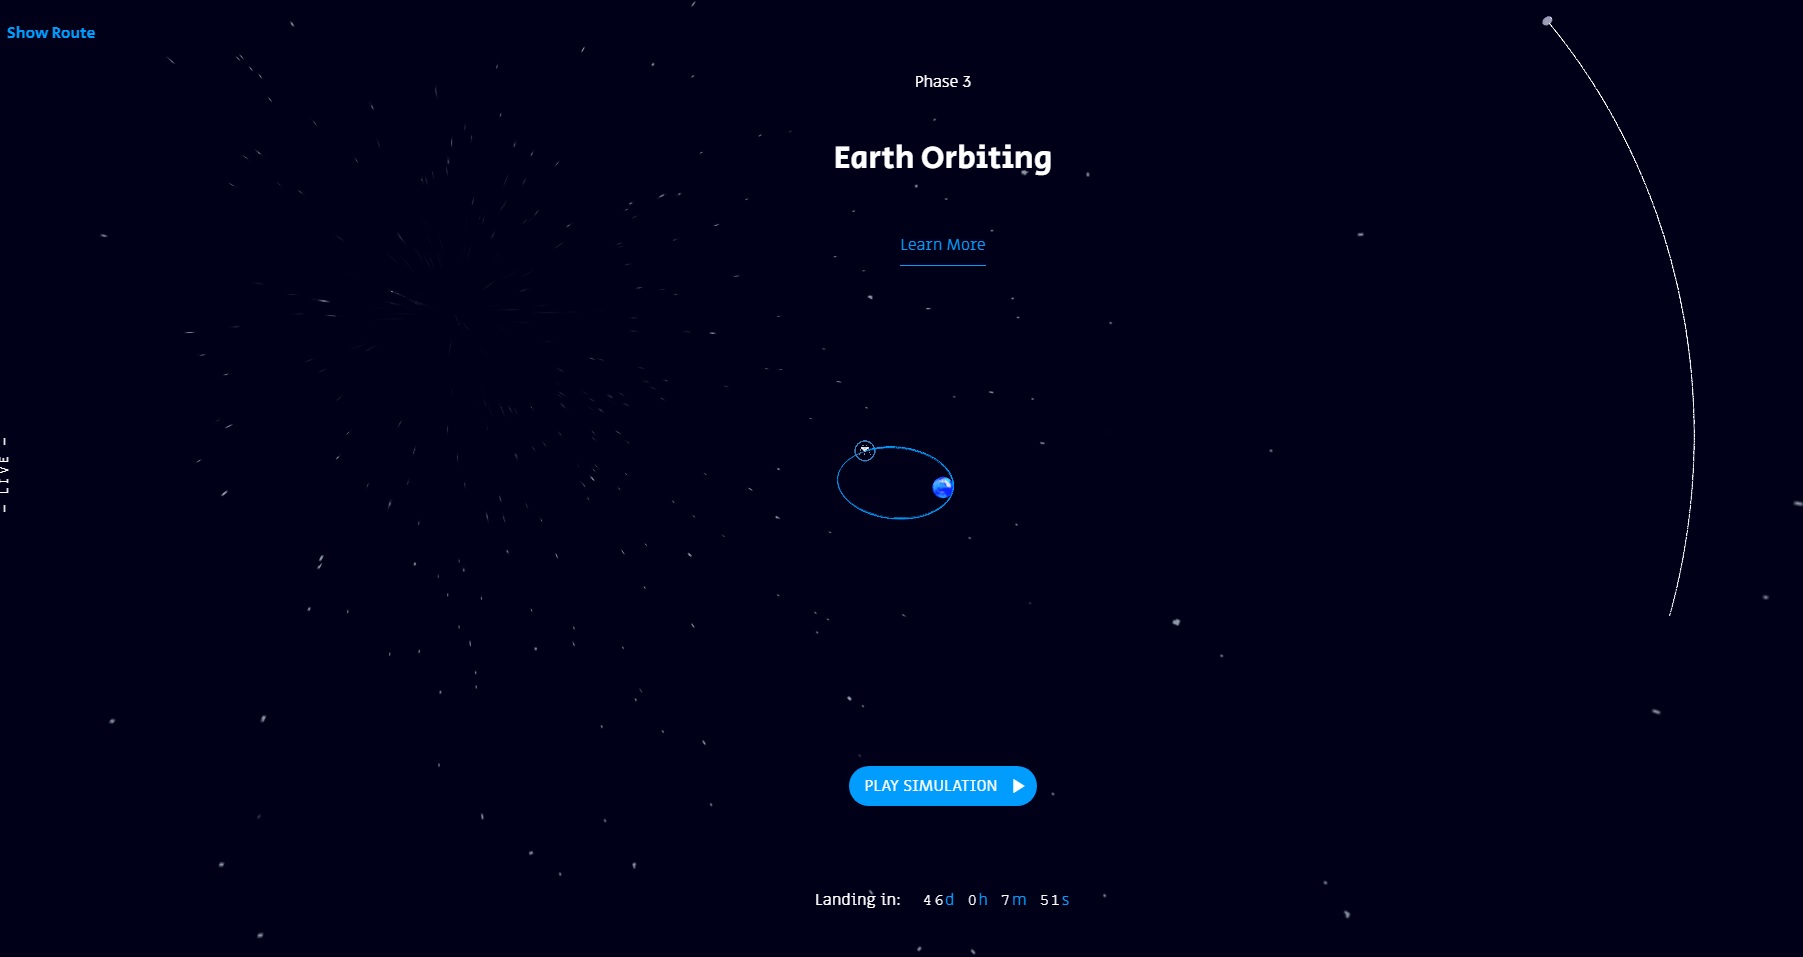
-使用鼠标滚轮,您可以更改图片的比例,按住鼠标左键,可以移动鼠标并更改图片的倾斜角度:
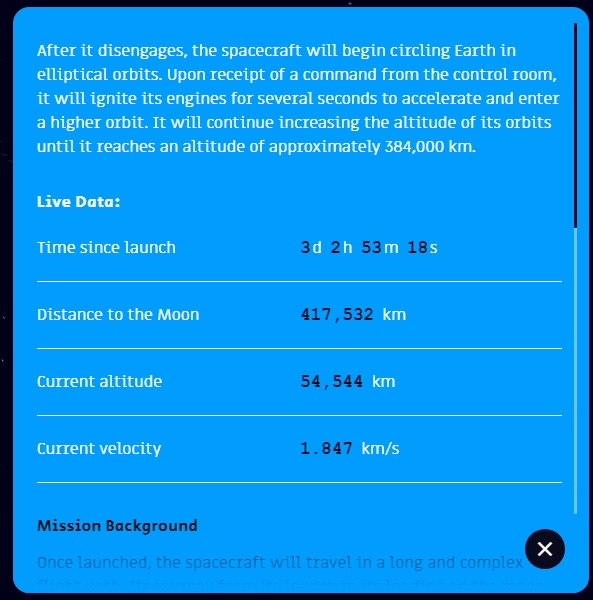
-通过单击屏幕中间的“了解更多”按钮,可以查看Bereshit设备参数的在线数据(数据一直在变化,这很有趣):
通过单击屏幕左上方的“显示路线”按钮,您可以查看Bereshit设备的计划轨迹(您可以通过单击“隐藏路线”按钮将其禁用):
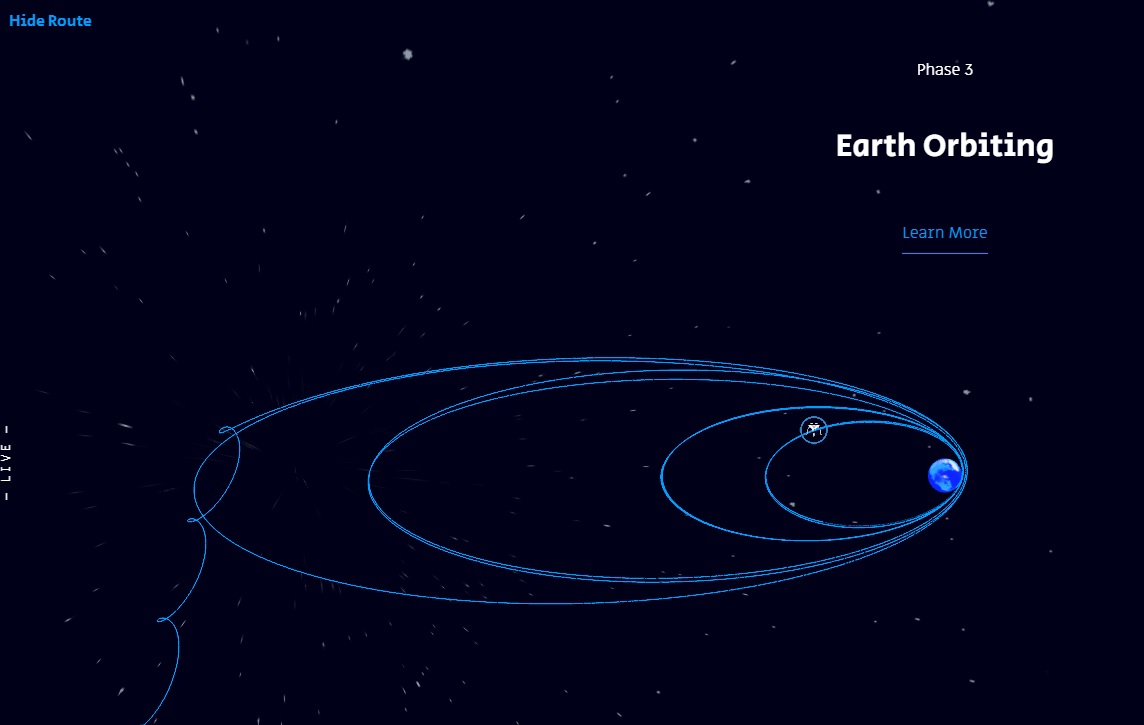
该项目中最有趣的部分是模拟,它在加速时间内以可视化方式向我们展示了已完成但尚未通过Bereshit设备的所有步骤。
因此,单击“播放模拟器”按钮:


顺便说一句,研究这个站点的代码也很有趣,也许我错过了一些东西,但是如果可能的话,如何在模拟器中暂停或改变其显示速度还不清楚。
查看源代码:http://live.spaceil.com<script> var currentTime = (new Date()).getTime();
模拟器的单独文件中的数据在
这里 :
live.spaceil.com/data/man.txtlive.spaceil.com/data/data_m.txtlive.spaceil.com/data/data_s1.txtlive.spaceil.com/data/data_s2.txt实时数据的数据是通过这种方式获得的(我想了解它是计算出的数据还是实际来自设备的数据),有趣的是,可以分别获得它们并根据参数值进行绘制:
实时数据 <div id="live_data_title">Live Data: </div> <table class="more_info_container"> <tbody> <tr> <td id="time_since_launch_label">Time since launch:</td><td id="time_since_launch_number">-</td></tr> <tr> <td id="distance_moon_label">Distance to the Moon:</td><td id="distance_moon_number">-</td></tr> <tr> <td id="altitude_label">Current altitude:</td><td id="altitude_number">-</td></tr> <tr> <td id="current_velocity_label">Current velocity:</td><td id="current_velocity_number">-</td></tr> </tbody> </table>
我认为将进一步开发该资源并添加新数据,因此我们在等待。
这是2月26日以来的首次更新-门户网站上的遥测将每24小时更新一次,这是由于解决了在设备上启动发动机进行机动的当前问题的解决方案:
令人惊奇的是,拥有如此有趣且信息丰富的在线资源,通过研究您可以成为太空研究历史的一部分。