千分尺用于收集JVM应用程序度量标准,并允许您将数据导出到各种监视系统。 在本文中,我将告诉您如何连接用于弹簧Web应用程序的Micrometer以及如何将数据导出到
Prometheus (
有关它的
不错的文章 )。 由于我的应用程序是在Spring 3中编写的,因此没有升级就无法使用Spring boot。 因此,您必须动手工作。
首先,我们需要Prometheus依赖项,客户端本身和用于导出数据的servlet:
pom.xml<dependency> <groupId>io.prometheus</groupId> <artifactId>simpleclient</artifactId> <version>0.6.0</version> </dependency> <dependency> <groupId>io.prometheus</groupId> <artifactId>simpleclient_servlet</artifactId> <version>0.6.0</version> </dependency>
接下来,将metlet导出servlet添加到web.xml并指定度量可用的路径:
<servlet> <servlet-name>prometheus</servlet-name> <servlet-class>io.prometheus.client.exporter.MetricsServlet</servlet-class> <load-on-startup>1</load-on-startup> </servlet> <servlet-mapping> <servlet-name>prometheus</servlet-name> <url-pattern>/metrics</url-pattern> </servlet-mapping>
如有必要,请不要忘记添加访问策略:
<http pattern="/metrics" security="none"/>
现在可以在localhost:8080 / metrics上获得统计信息,但是现在这是空白页。 为了使数据出现在其中,您需要注册应用程序指标的集合。
要使用测微计添加依赖项:
pom.xml <dependency> <groupId>io.micrometer</groupId> <artifactId>micrometer-core</artifactId> <version>1.1.3</version> </dependency> <dependency> <groupId>io.micrometer</groupId> <artifactId>micrometer-registry-prometheus</artifactId> <version>1.1.3</version> </dependency>
接下来,您需要注册必要的指标收集器:
@WebListener public class PrometheusInitListener implements ServletContextListener { @Override public void contextInitialized(ServletContextEvent sce) { PrometheusMeterRegistry meterRegistry = new PrometheusMeterRegistry(PrometheusConfig.DEFAULT, CollectorRegistry.defaultRegistry, Clock.SYSTEM); new ClassLoaderMetrics().bindTo(meterRegistry); new JvmMemoryMetrics().bindTo(meterRegistry); new JvmGcMetrics().bindTo(meterRegistry); new ProcessorMetrics().bindTo(meterRegistry); new JvmThreadMetrics().bindTo(meterRegistry); } @Override public void contextDestroyed(ServletContextEvent sce) { } }
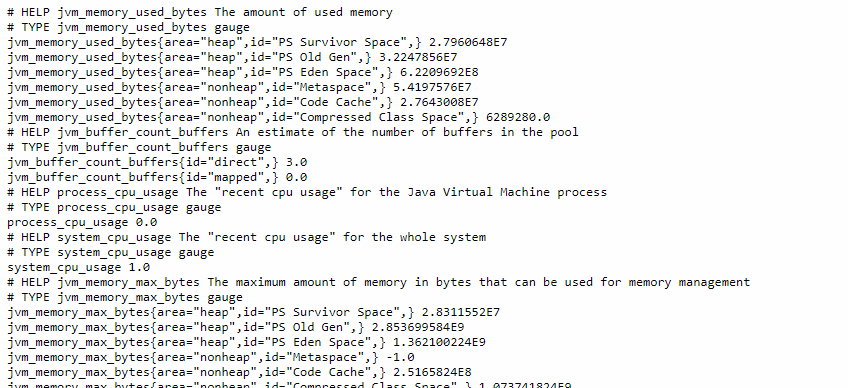
完成,现在,如果我们切换到localhost:8080 / metrics,我们将在JVM上获取数据。
看起来像这样:
Prometheus拥有自己的用于
simpleclient_hotspot应用程序JVM统计信息的库,该库通过调用DefaultExports.initialize()进行配置。 在Web侦听器初始化方法中。
要在prometheus.yml中配置指标收集,请添加目标:
scrape_configs: - job_name: 'test-server' # Override the global default and scrape targets from this job every 5 seconds. scrape_interval: 5s metrics_path: /metrics static_configs: - targets: ['localhost:8080']
可以使用特殊语言PromQL查看Prometheus中收集的指标。 Micrometr的优点是您无法编写任何内容,但可以使用度量标准可视化系统的现成插件。
 在Grafana中显示应用程序指标,插件4683