
在诊断Kubernetes集群中的问题时,我们经常会注意到有时集群节点之一会细雨*,当然,这是罕见且奇怪的。 因此,我们需要一种可以
在每个节点之间进行ping操作并以
Prometheus度量形式呈现其工作结果的工具。 我们只需要在Grafana中绘制图形并快速定位失败的节点即可(并且,如有必要,从中删除所有节点,然后进行相应的工作**)...
*通过“ NotReady ”,我知道该节点可以进入NotReady状态并突然恢复工作。 或者,例如,pod中的部分流量可能无法到达相邻节点上的pod。**为什么会出现这种情况? 常见原因之一可能是数据中心交换机上的网络问题。 例如,曾经在Hetzner上配置过vswitch,但在一个美妙的时刻,其中一个节点不再可以在此vswitch端口上访问:因此,事实证明该节点在本地网络上完全不可访问。另外,我们想
直接在Kubernetes中启动这样的服务 ,以便整个部署通过使用Helm-chart进行。 (预想的问题-如果使用相同的Ansible,我们将不得不为各种环境编写角色:AWS,GCE,裸机...)在Internet上搜索了用于该任务的现成工具时,我们找不到任何合适的工具。 因此,他们做了自己的。
脚本和配置
因此,我们解决方案的主要组件是一个
脚本 ,该
脚本监视
.status.addresses字段中任何节点的更改,并且如果某个字段的某个节点发生了更改(即已添加了新节点),则使用以下命令将Helm值发送到图表ConfigMap形式的节点列表:
--- apiVersion: v1 kind: ConfigMap metadata: name: node-ping-config namespace: kube-prometheus data: nodes.json: > {{ .Values.nodePing.nodes | toJson }}
它
在每个节点上运行 ,并每秒两次将ICMP数据包发送到所有其他Kubernetes集群实例,然后将结果写入文本文件。
该脚本包含在
Docker映像中 :
FROM python:3.6-alpine3.8 COPY rootfs / WORKDIR /app RUN pip3 install --upgrade pip && pip3 install -r requirements.txt && apk add --no-cache fping ENTRYPOINT ["python3", "/app/node-ping.py"]
另外,创建了一个
ServiceAccount并为其指定了一个角色,该角色仅允许接收节点列表(以便知道其地址):
--- apiVersion: v1 kind: ServiceAccount metadata: name: node-ping namespace: kube-prometheus --- kind: ClusterRole apiVersion: rbac.authorization.k8s.io/v1 metadata: name: kube-prometheus:node-ping rules: - apiGroups: [""] resources: ["nodes"] verbs: ["list"] --- kind: ClusterRoleBinding apiVersion: rbac.authorization.k8s.io/v1 metadata: name: kube-prometheus:kube-node-ping subjects: - kind: ServiceAccount name: node-ping namespace: kube-prometheus roleRef: apiGroup: rbac.authorization.k8s.io kind: ClusterRole name: kube-prometheus:node-ping
最后,您需要
DaemonSet ,它可以在集群的所有实例上运行:
--- apiVersion: extensions/v1beta1 kind: DaemonSet metadata: name: node-ping namespace: kube-prometheus labels: tier: monitoring app: node-ping version: v1 spec: updateStrategy: type: RollingUpdate template: metadata: labels: name: node-ping spec: terminationGracePeriodSeconds: 0 tolerations: - operator: "Exists" serviceAccountName: node-ping priorityClassName: cluster-low containers: - resources: requests: cpu: 0.10 image: private-registry.flant.com/node-ping/node-ping-exporter:v1 imagePullPolicy: Always name: node-ping env: - name: MY_NODE_NAME valueFrom: fieldRef: fieldPath: spec.nodeName - name: PROMETHEUS_TEXTFILE_DIR value: /node-exporter-textfile/ - name: PROMETHEUS_TEXTFILE_PREFIX value: node-ping_ volumeMounts: - name: textfile mountPath: /node-exporter-textfile - name: config mountPath: /config volumes: - name: textfile hostPath: path: /var/run/node-exporter-textfile - name: config configMap: name: node-ping-config imagePullSecrets: - name: antiopa-registry
文字摘要:
- Python脚本结果-即 放在主机上
/var/run/node-exporter-textfile textfile目录中的文本文件进入DaemonSet node-exporter。 运行它的参数表示--collector.textfile.directory /host/textfile ,其中/host/textfile是/var/run/node-exporter-textfile上的hostPath。 (您可以在node-exporter中了解有关文本文件收集器的信息 。) - 结果,node-exporter读取了这些文件,Prometheus从node-exporter收集了所有数据。
怎么了
现在-期待已久的结果。 创建此类指标后,我们可以对其进行查看,当然,还可以绘制可视图形。 这就是它的样子。
首先,有一个通用模块具有(使用选择器)能力,可以从中选择要执行ping操作的节点列表。 这是在Grafana仪表板中指定的时间段内在选定节点之间执行ping操作的
摘要表 :
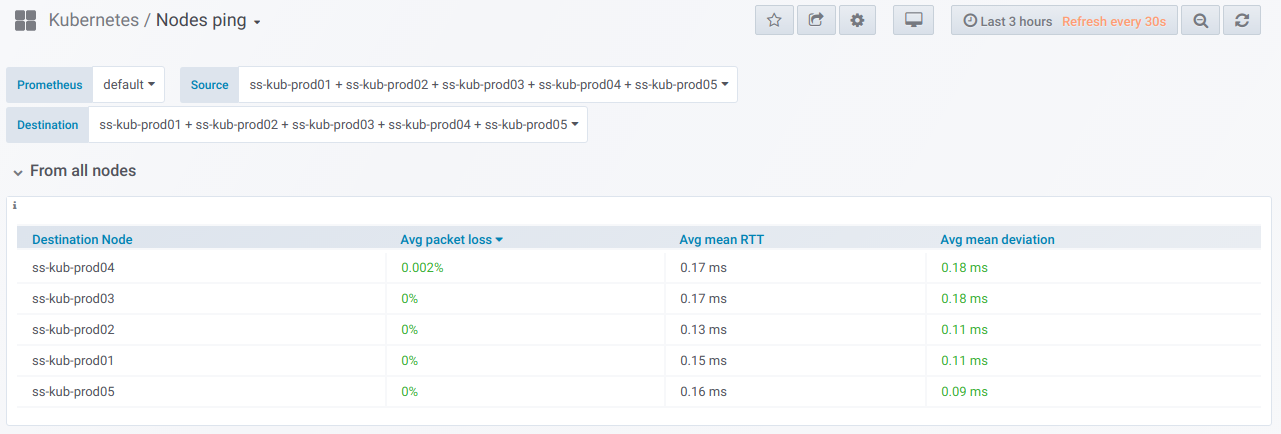
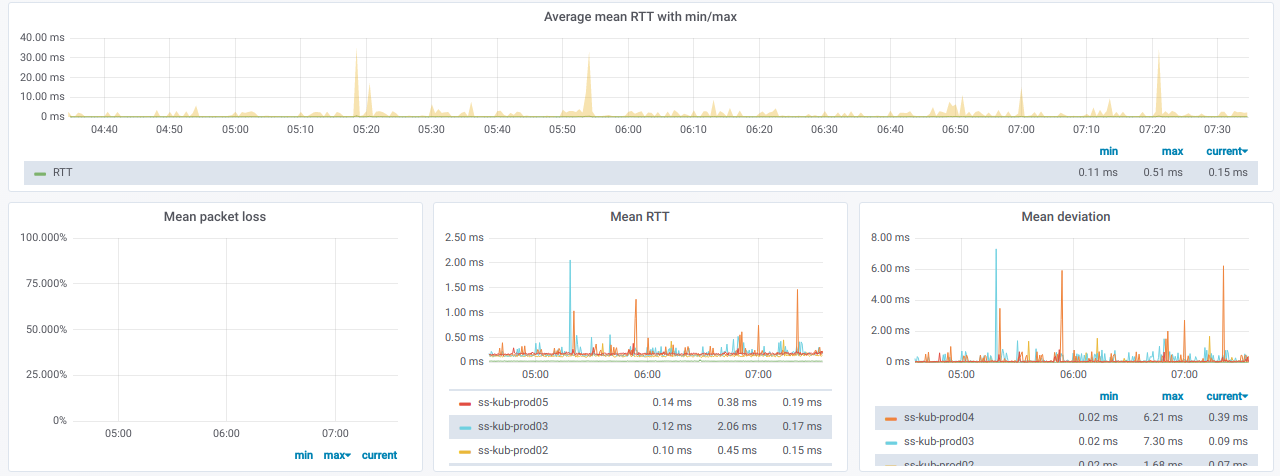
以下是
有关选定节点的一般信息的图:
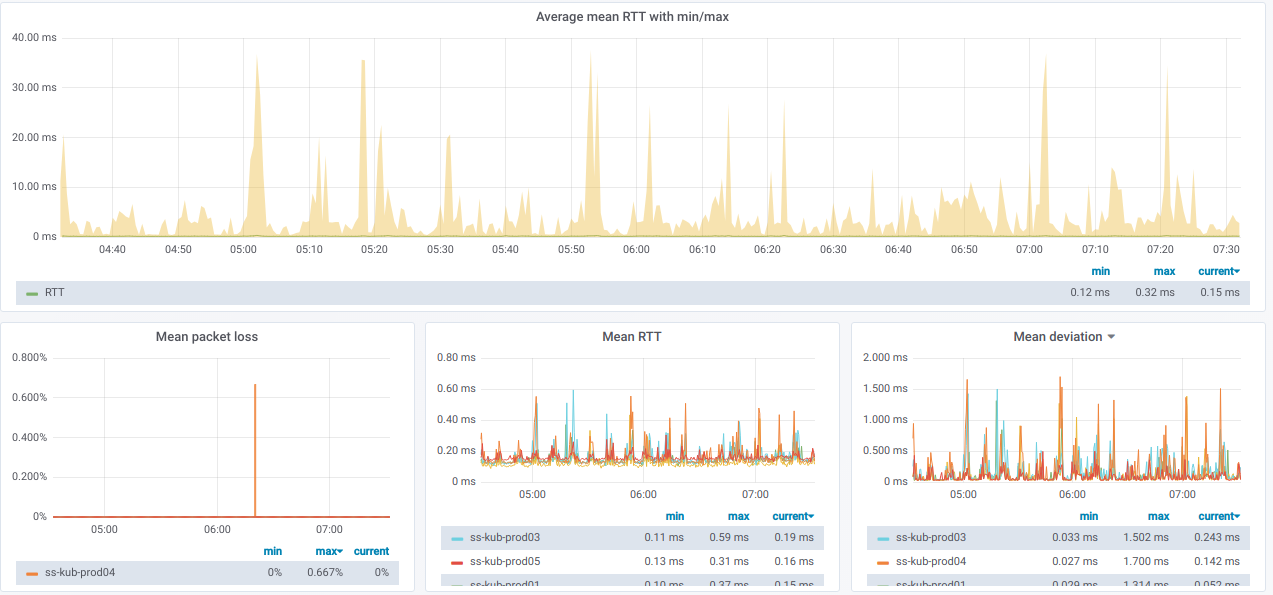
我们还有一行线的列表,每行是一个与“
源”节点选择器
分开的单独节点的图形:
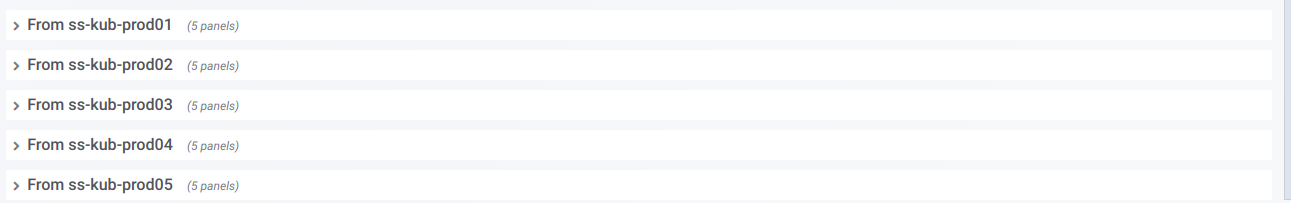
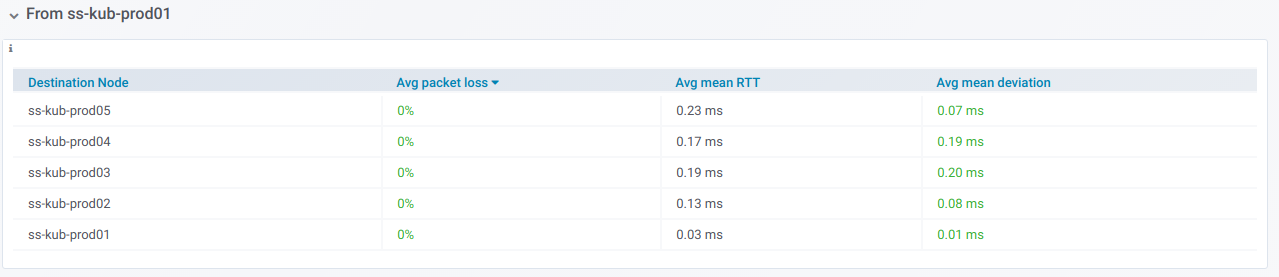
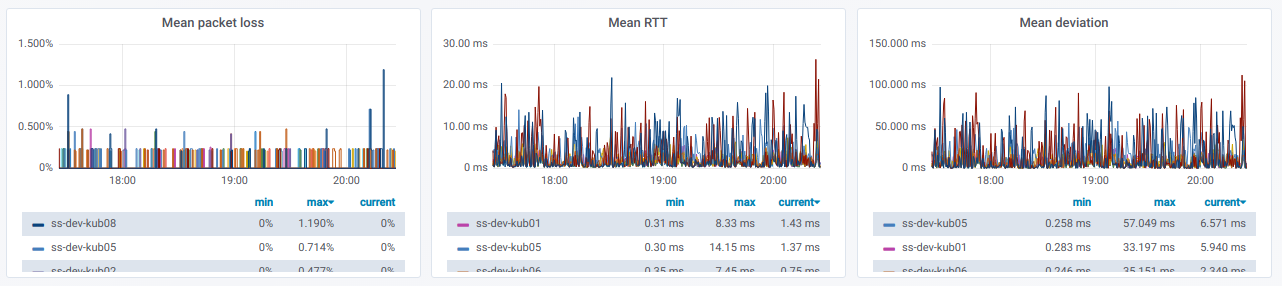
如果展开这样的行,则可以查看有关
从特定节点到在“
目标节点”选择器中选择的
所有其他节点 ping的信息:
此信息以图表形式显示:
最后,如果节点之间的ping不佳,那么珍贵的图将是什么样子?
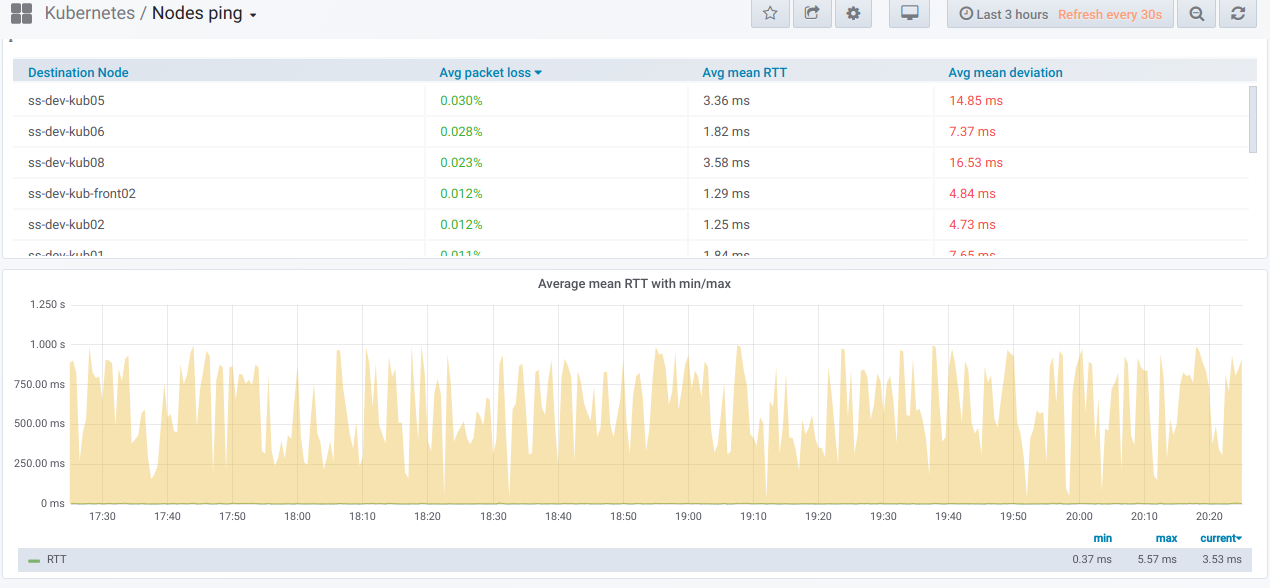
如果您在真实环境中观察到这种情况,那么该是找出原因的时候了。
聚苯乙烯
另请参阅我们的博客: