
这里的 1/3部分。
第2/3部分。
大家好! 这是Kubernetes裸机指南的第三部分! 我将注意监视集群并收集日志,我们还将启动一个测试应用程序以使用预先配置的集群组件。 然后,我们将进行一些压力测试,并检查该群集方案的稳定性。
Kubernetes社区提供的最流行的工具是提供基于Web的界面和获取集群统计信息的工具是Kubernetes Dashboard 。 实际上,它仍在开发中,但是即使到现在,它仍可以提供一些其他数据来对应用程序问题进行故障排除和管理集群资源。
该主题部分有争议。 您是否需要某种Web界面来管理集群,还是使用kubectl控制台工具就足够了? 好吧,有时这些选择可以相互补充。
让我们扩展Kubernetes仪表板看看。 对于标准部署,此仪表板将仅从本地主机地址开始。 因此,您需要使用kubectl proxy命令进行扩展 ,但该命令仍仅在本地kubectl控制设备上可用。 从安全性的角度来看还不错,但是我想在集群外部的浏览器中进行访问,并且愿意承担一些风险(毕竟,使用具有有效令牌的ssl)。
要应用我的方法,您需要在服务部分中稍微修改标准部署文件。 要在开放地址上打开此仪表板,我们使用负载均衡器。
我们使用配置的kubectl实用程序进入机器系统并创建:
control# vi kube-dashboard.yaml # Copyright 2017 The Kubernetes Authors. # # Licensed under the Apache License, Version 2.0 (the "License"); # you may not use this file except in compliance with the License. # You may obtain a copy of the License at # # http://www.apache.org/licenses/LICENSE-2.0 # # Unless required by applicable law or agreed to in writing, software # distributed under the License is distributed on an "AS IS" BASIS, # WITHOUT WARRANTIES OR CONDITIONS OF ANY KIND, either express or implied. # See the License for the specific language governing permissions and # limitations under the License. # ------------------- Dashboard Secret ------------------- # apiVersion: v1 kind: Secret metadata: labels: k8s-app: kubernetes-dashboard name: kubernetes-dashboard-certs namespace: kube-system type: Opaque --- # ------------------- Dashboard Service Account ------------------- # apiVersion: v1 kind: ServiceAccount metadata: labels: k8s-app: kubernetes-dashboard name: kubernetes-dashboard namespace: kube-system --- # ------------------- Dashboard Role & Role Binding ------------------- # kind: Role apiVersion: rbac.authorization.k8s.io/v1 metadata: name: kubernetes-dashboard-minimal namespace: kube-system rules: # Allow Dashboard to create 'kubernetes-dashboard-key-holder' secret. - apiGroups: [""] resources: ["secrets"] verbs: ["create"] # Allow Dashboard to create 'kubernetes-dashboard-settings' config map. - apiGroups: [""] resources: ["configmaps"] verbs: ["create"] # Allow Dashboard to get, update and delete Dashboard exclusive secrets. - apiGroups: [""] resources: ["secrets"] resourceNames: ["kubernetes-dashboard-key-holder", "kubernetes-dashboard-certs"] verbs: ["get", "update", "delete"] # Allow Dashboard to get and update 'kubernetes-dashboard-settings' config map. - apiGroups: [""] resources: ["configmaps"] resourceNames: ["kubernetes-dashboard-settings"] verbs: ["get", "update"] # Allow Dashboard to get metrics from heapster. - apiGroups: [""] resources: ["services"] resourceNames: ["heapster"] verbs: ["proxy"] - apiGroups: [""] resources: ["services/proxy"] resourceNames: ["heapster", "http:heapster:", "https:heapster:"] verbs: ["get"] --- apiVersion: rbac.authorization.k8s.io/v1 kind: RoleBinding metadata: name: kubernetes-dashboard-minimal namespace: kube-system roleRef: apiGroup: rbac.authorization.k8s.io kind: Role name: kubernetes-dashboard-minimal subjects: - kind: ServiceAccount name: kubernetes-dashboard namespace: kube-system --- # ------------------- Dashboard Deployment ------------------- # kind: Deployment apiVersion: apps/v1 metadata: labels: k8s-app: kubernetes-dashboard name: kubernetes-dashboard namespace: kube-system spec: replicas: 1 revisionHistoryLimit: 10 selector: matchLabels: k8s-app: kubernetes-dashboard template: metadata: labels: k8s-app: kubernetes-dashboard spec: containers: - name: kubernetes-dashboard image: k8s.gcr.io/kubernetes-dashboard-amd64:v1.10.1 ports: - containerPort: 8443 protocol: TCP args: - --auto-generate-certificates # Uncomment the following line to manually specify Kubernetes API server Host # If not specified, Dashboard will attempt to auto discover the API server and connect # to it. Uncomment only if the default does not work. # - --apiserver-host=http://my-address:port volumeMounts: - name: kubernetes-dashboard-certs mountPath: /certs # Create on-disk volume to store exec logs - mountPath: /tmp name: tmp-volume livenessProbe: httpGet: scheme: HTTPS path: / port: 8443 initialDelaySeconds: 30 timeoutSeconds: 30 volumes: - name: kubernetes-dashboard-certs secret: secretName: kubernetes-dashboard-certs - name: tmp-volume emptyDir: {} serviceAccountName: kubernetes-dashboard # Comment the following tolerations if Dashboard must not be deployed on master tolerations: - key: node-role.kubernetes.io/master effect: NoSchedule --- # ------------------- Dashboard Service ------------------- # kind: Service apiVersion: v1 metadata: labels: k8s-app: kubernetes-dashboard name: kubernetes-dashboard namespace: kube-system spec: type: LoadBalancer ports: - port: 443 targetPort: 8443 selector: k8s-app: kubernetes-dashboard
然后运行:
control# kubectl create -f kube-dashboard.yaml control# kubectl get svc --namespace=kube-system kubernetes-dashboard LoadBalancer 10.96.164.141 192.168.0.240 443:31262/TCP 8h
好了,正如您所看到的,我们的BN为此服务添加了IP 192.168.0.240。 现在尝试打开https://192.168.0.240来查看Kubernetes仪表板。
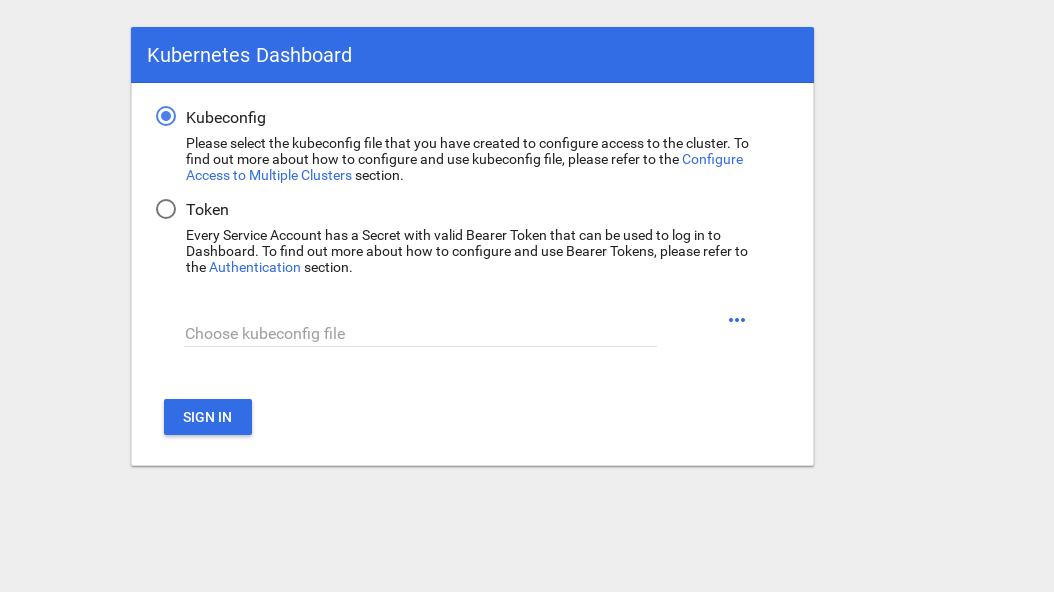
有两种获取访问权限的方法:使用我们的主节点中的admin.conf文件(我们在设置kubectl时曾使用过该文件),或使用安全令牌创建一个特殊的服务帐户。
让我们创建一个管理员用户:
control# vi kube-dashboard-admin.yaml apiVersion: v1 kind: ServiceAccount metadata: name: admin-user namespace: kube-system --- apiVersion: rbac.authorization.k8s.io/v1beta1 kind: ClusterRoleBinding metadata: name: admin-user roleRef: apiGroup: rbac.authorization.k8s.io kind: ClusterRole name: cluster-admin subjects: - kind: ServiceAccount name: admin-user namespace: kube-system control# kubectl create -f kube-dashboard-admin.yaml serviceaccount/admin-user created clusterrolebinding.rbac.authorization.k8s.io/admin-user created
现在,您需要一个令牌才能进入系统:
control# kubectl -n kube-system describe secret $(kubectl -n kube-system get secret | grep admin-user | awk '{print $1}') Name: admin-user-token-vfh66 Namespace: kube-system Labels: <none> Annotations: kubernetes.io/service-account.name: admin-user kubernetes.io/service-account.uid: 3775471a-3620-11e9-9800-763fc8adcb06 Type: kubernetes.io/service-account-token Data ==== ca.crt: 1025 bytes namespace: 11 bytes token: erJhbGciOiJSUzI1NiIsImtpZCI6IiJ9.eyJpc3MiOiJrdWJlcm5ldGVzL3NlcnZpY2VhY2NvdW50Iiwna3ViZXJuZXRlcy5pby9zZXJ2aWNlYWNjb3VudC9uYW1lc3BhY2UiOiJr dWJlLXN5c3RlbSIsImt1YmVybmV0ZXMuaW8vc2VydmljZWFjY291bnQvc2VjcmV0Lm5hbWUiOiJhZG1pbi11c2VmLXRva2VuLXZmaDY2Iiwia3ViZXJuZXRlcy5pby9zZXJ2aWNlYWNjb3VudC9zZ XJ2aWNlLWFjY291bnQubmFtZSI6ImFkbWluLXVzZXIiLCJrdWJlcm5ldGVzLmlvL3NlcnZpY2VhY2NvdW50L3NlcnZpY2UtYWNjb3VudC51aWQiOiIzNzc1NDcxYS0zNjIwLTExZTktOTgwMC03Nj NmYzhhZGNiMDYiLCJzdWIiOiJzeXN0ZW06c2VydmljZWFjY291bnQ6a3ViZS1zeXN0ZW06YWRtaW4tdXNlciJ9.JICASwxAJHFX8mLoSikJU1tbij4Kq2pneqAt6QCcGUizFLeSqr2R5x339ZR8W4 9cIsbZ7hbhFXCATQcVuWnWXe2dgXP5KE8ZdW9uvq96rm_JvsZz0RZO03UFRf8Exsss6GLeRJ5uNJNCAr8No5pmRMJo-_4BKW4OFDFxvSDSS_ZJaLMqJ0LNpwH1Z09SfD8TNW7VZqax4zuTSMX_yVS ts40nzh4-_IxDZ1i7imnNSYPQa_Oq9ieJ56Q-xuOiGu9C3Hs3NmhwV8MNAcniVEzoDyFmx4z9YYcFPCDIoerPfSJIMFIWXcNlUTPSMRA-KfjSb_KYAErVfNctwOVglgCISA
复制令牌并将其粘贴到登录屏幕上的令牌字段中。
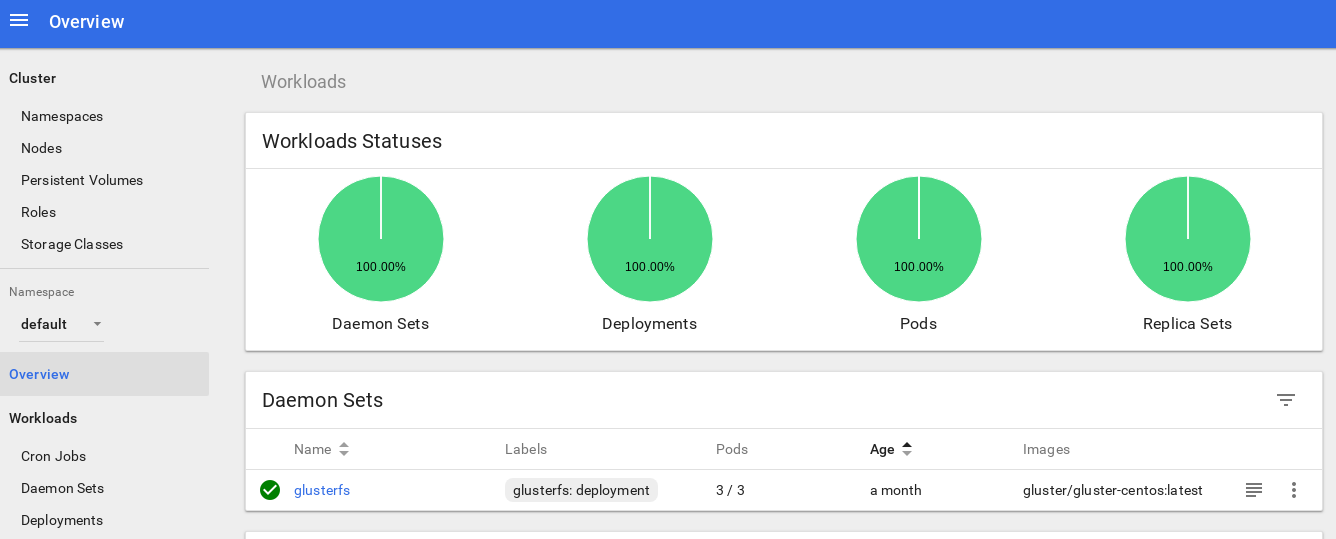
进入系统后,您可以对集群进行更深入的研究-我喜欢这个工具。
深化我们集群的监视系统的下一步是安装heapster 。
Heapster允许您监视容器集群并分析Kubernetes (版本1.0.6和更高版本)的性能。 它提供适当的平台。
该工具通过控制台提供了有关群集使用情况的统计信息,还向Kubernetes仪表板添加了有关节点和炉膛资源的更多信息。
在裸机上安装它几乎没有什么困难,我需要进行一些调查:为什么该工具在原始版本中不起作用,但是我找到了解决方案。
因此,让我们继续并认可此附加组件:
control# vi heapster.yaml apiVersion: v1 kind: ServiceAccount metadata: name: heapster namespace: kube-system --- apiVersion: extensions/v1beta1 kind: Deployment metadata: name: heapster namespace: kube-system spec: replicas: 1 template: metadata: labels: task: monitoring k8s-app: heapster spec: serviceAccountName: heapster containers: - name: heapster image: gcr.io/google_containers/heapster-amd64:v1.4.2 imagePullPolicy: IfNotPresent command: - /heapster - --source=kubernetes.summary_api:''?useServiceAccount=true&kubeletHttps=true&kubeletPort=10250&insecure=true --- apiVersion: v1 kind: Service metadata: labels: task: monitoring # For use as a Cluster add-on (https://github.com/kubernetes/kubernetes/tree/master/cluster/addons) # If you are NOT using this as an addon, you should comment out this line. kubernetes.io/cluster-service: 'true' kubernetes.io/name: Heapster name: heapster namespace: kube-system spec: ports: - port: 80 targetPort: 8082 selector: k8s-app: heapster --- kind: ClusterRoleBinding apiVersion: rbac.authorization.k8s.io/v1beta1 metadata: name: heapster roleRef: apiGroup: rbac.authorization.k8s.io kind: ClusterRole name: system:heapster subjects: - kind: ServiceAccount name: heapster namespace: kube-system
这是Heapster社区中最常见的标准部署文件,只有一点点不同:为了使其在我们的集群上正常工作,heapster部署中的“ source = ”行更改如下:
--source=kubernetes.summary_api:''?useServiceAccount=true&kubeletHttps=true&kubeletPort=10250&insecure=true
在此说明中,您将找到所有这些选项。 我将kubelet端口更改为10250,并关闭了ssl证书验证(它存在一些问题)。
我们还需要添加权限以获取Heapster RBAC角色中的节点统计信息。 在角色末尾添加以下几行:
control# kubectl edit clusterrole system:heapster ...... ... - apiGroups: - "" resources: - nodes/stats verbs: - get
总之,您的RBAC角色应如下所示:
# Please edit the object below. Lines beginning with a '#' will be ignored, # and an empty file will abort the edit. If an error occurs while saving this file will be # reopened with the relevant failures. # apiVersion: rbac.authorization.k8s.io/v1 kind: ClusterRole metadata: annotations: rbac.authorization.kubernetes.io/autoupdate: "true" creationTimestamp: "2019-02-22T18:58:32Z" labels: kubernetes.io/bootstrapping: rbac-defaults name: system:heapster resourceVersion: "6799431" selfLink: /apis/rbac.authorization.k8s.io/v1/clusterroles/system%3Aheapster uid: d99065b5-36d3-11e9-a7e6-763fc8adcb06 rules: - apiGroups: - "" resources: - events - namespaces - nodes - pods verbs: - get - list - watch - apiGroups: - extensions resources: - deployments verbs: - get - list - watch - apiGroups: - "" resources: - nodes/stats verbs: - get
好的,现在让我们运行命令以确保成功启动了heapster部署。
control# kubectl top node NAME CPU(cores) CPU% MEMORY(bytes) MEMORY% kube-master1 183m 9% 1161Mi 60% kube-master2 235m 11% 1130Mi 59% kube-worker1 189m 4% 1216Mi 41% kube-worker2 218m 5% 1290Mi 44% kube-worker3 181m 4% 1305Mi 44%
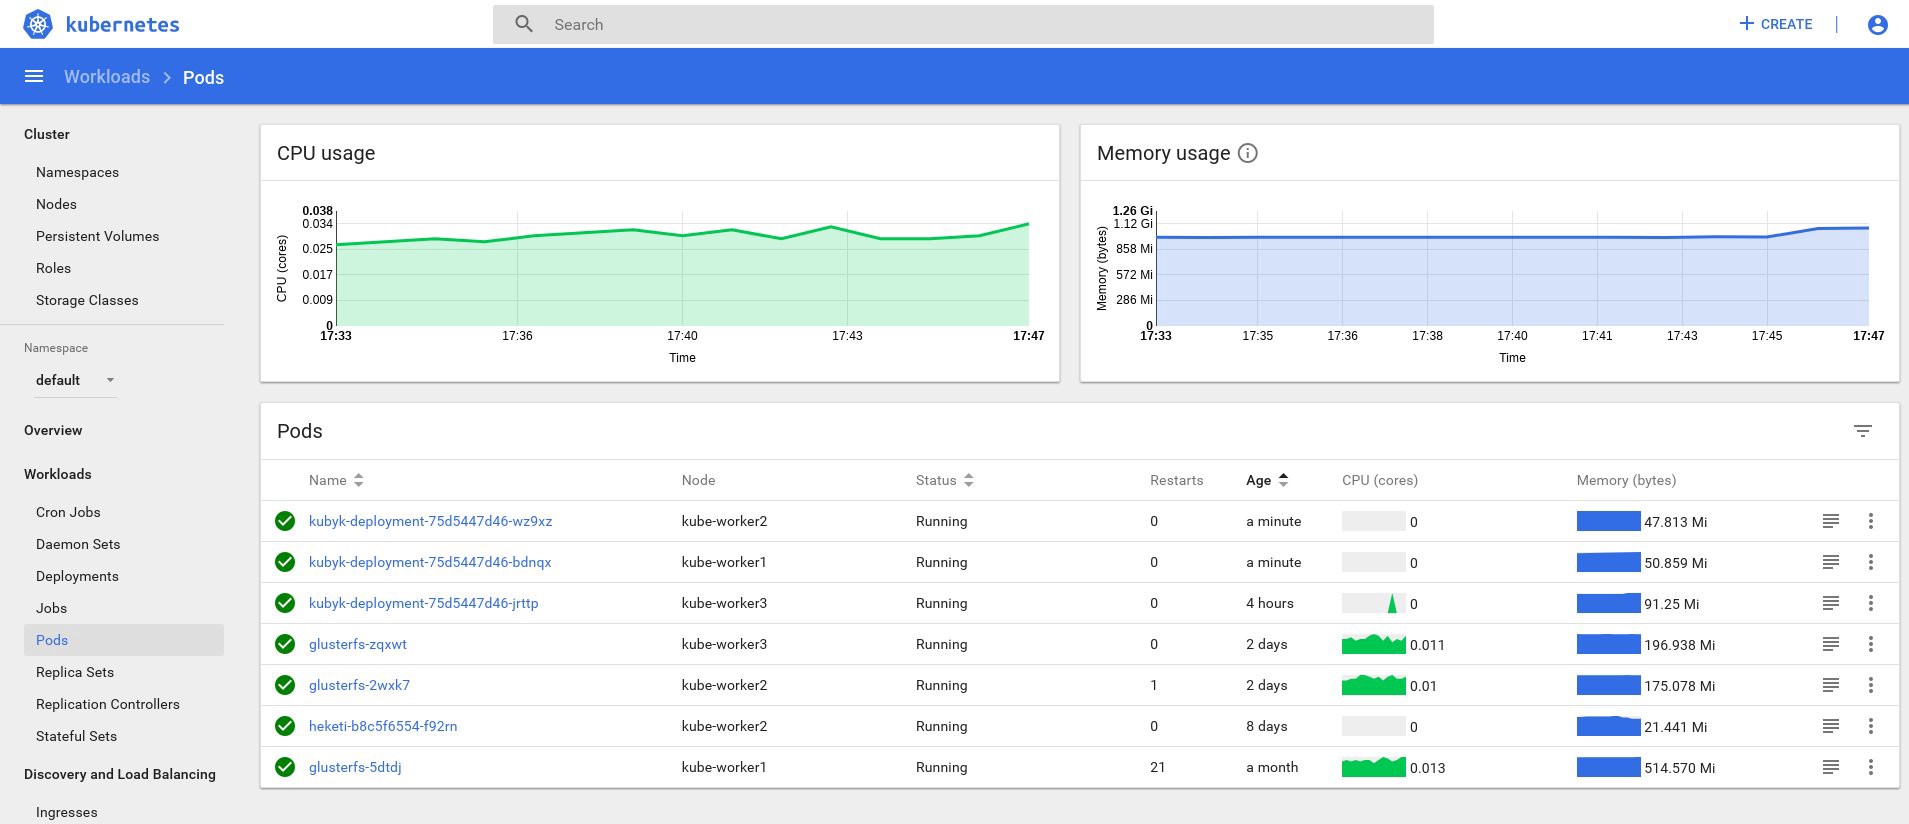
好吧,如果您在输出中收到了一些数据,则说明一切正确。 让我们回到我们的仪表板页面,查看现在可用的新图形。
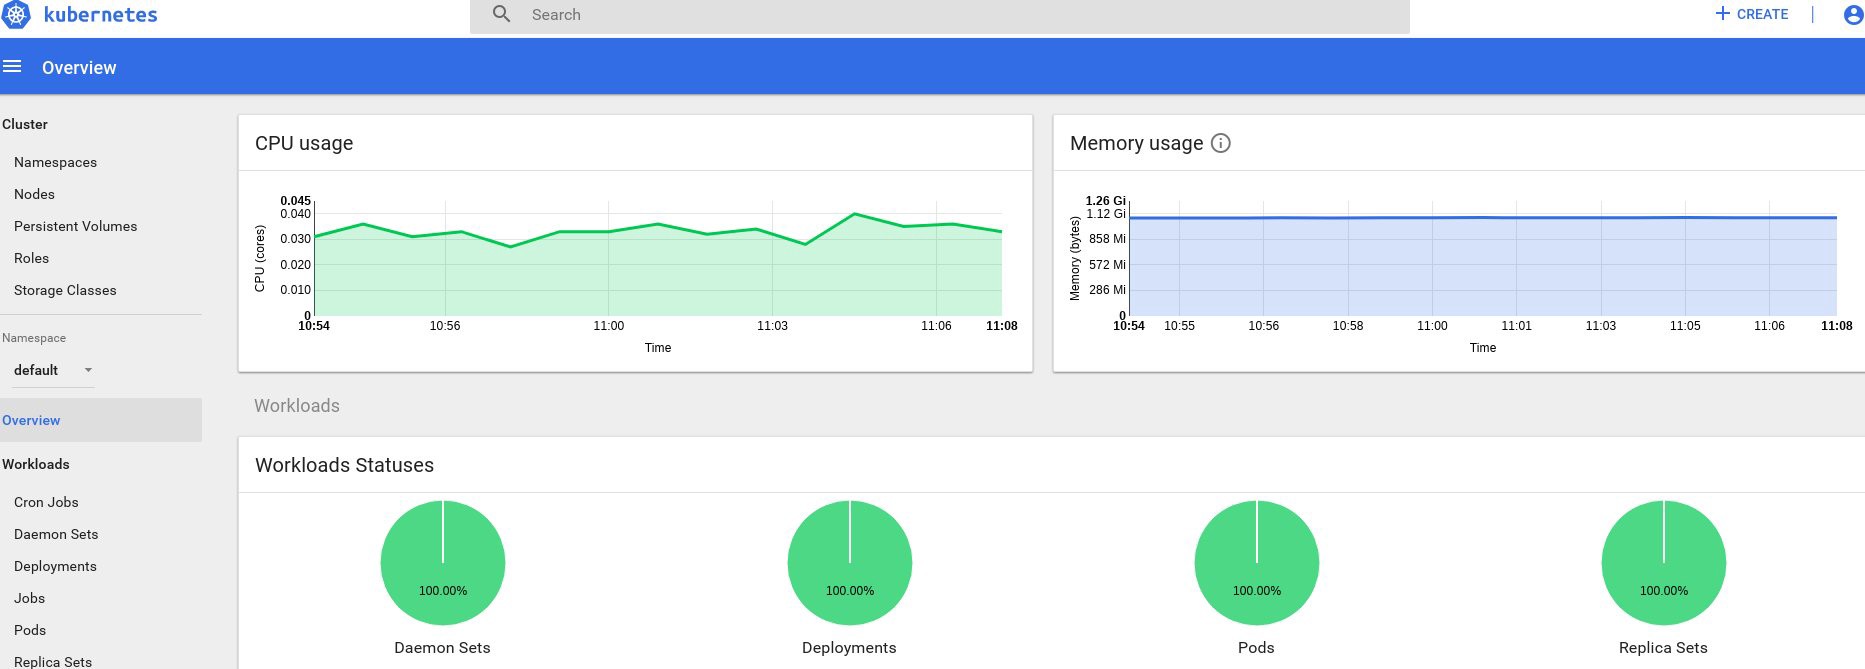

从现在开始,我们还可以跟踪群集节点,炉膛等资源的实际使用情况。
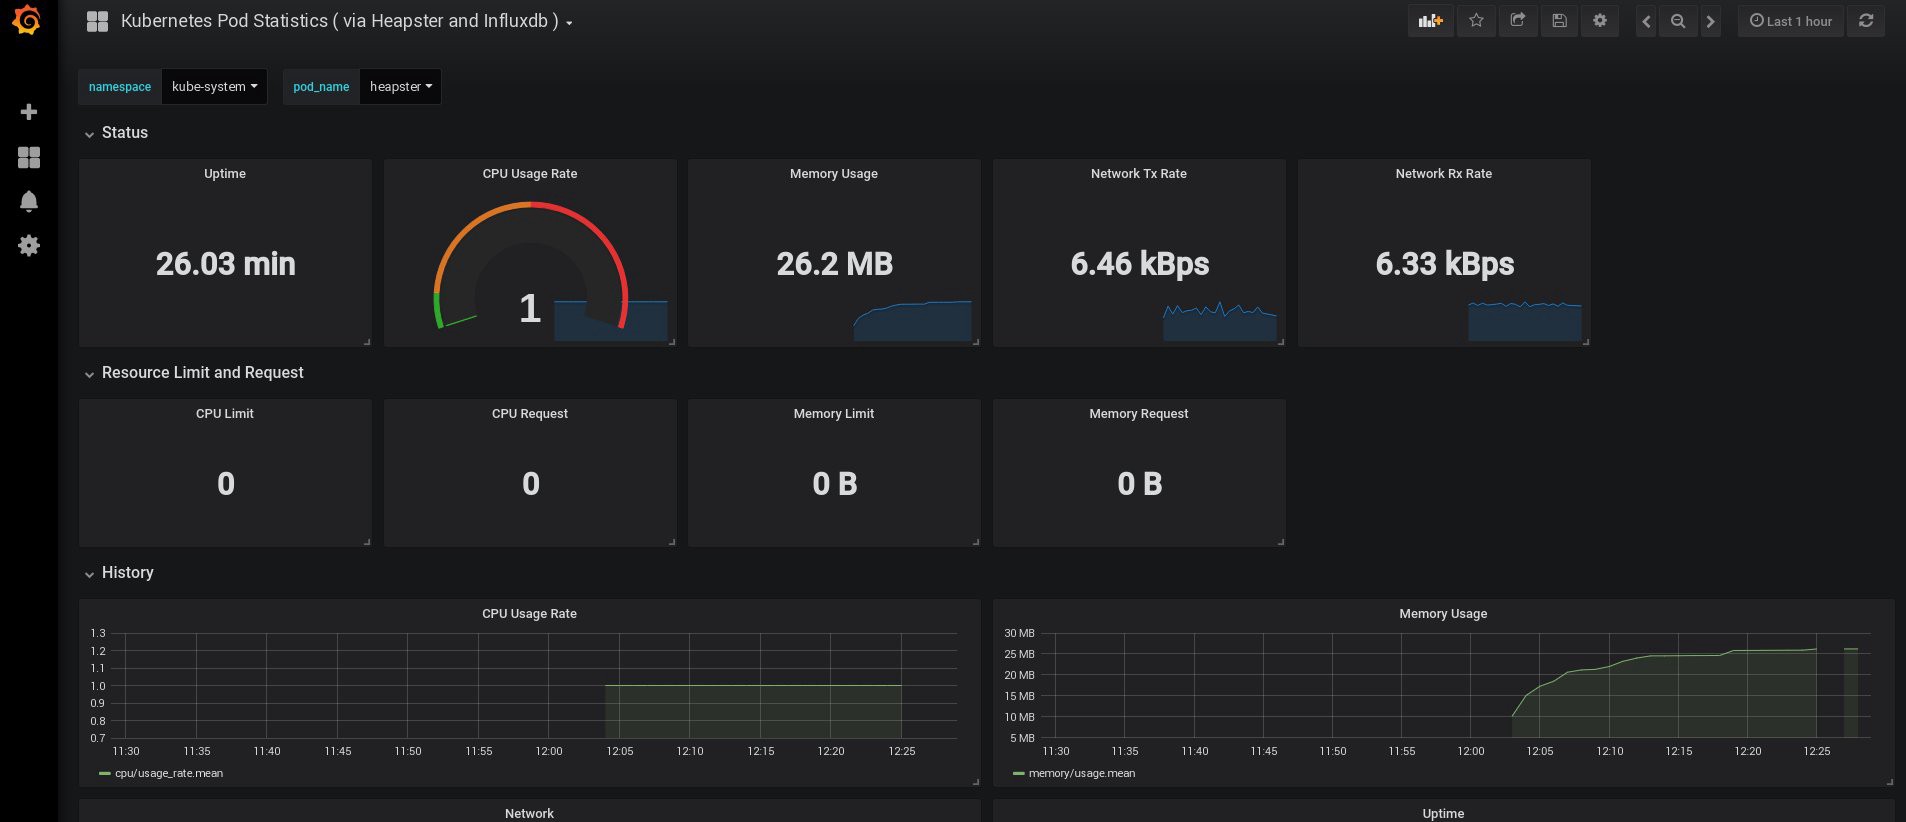
如果这还不够,您可以通过添加InfluxDB + Grafana进一步改善统计信息。 这将增加绘制自己的Grafana面板的功能。
我们将在Heapster Git页面上使用此版本的InfluxDB + Grafana安装 ,但是,像往常一样,我们将进行更正。 由于我们已经配置了heapster部署,因此我们只需要添加Grafana和InfluxDB,然后修改现有的heapster部署,以便将指标也放入Influx。
好的,让我们创建InfluxDB和Grafana部署:
control# vi influxdb.yaml apiVersion: extensions/v1beta1 kind: Deployment metadata: name: monitoring-influxdb namespace: kube-system spec: replicas: 1 template: metadata: labels: task: monitoring k8s-app: influxdb spec: containers: - name: influxdb image: k8s.gcr.io/heapster-influxdb-amd64:v1.5.2 volumeMounts: - mountPath: /data name: influxdb-storage volumes: - name: influxdb-storage emptyDir: {} --- apiVersion: v1 kind: Service metadata: labels: task: monitoring # For use as a Cluster add-on (https://github.com/kubernetes/kubernetes/tree/master/cluster/addons) # If you are NOT using this as an addon, you should comment out this line. kubernetes.io/cluster-service: 'true' kubernetes.io/name: monitoring-influxdb name: monitoring-influxdb namespace: kube-system spec: ports: - port: 8086 targetPort: 8086 selector: k8s-app: influxdb
接下来是Grafana,不要忘记更改服务设置以启用MetaLB负载平衡器并获取Grafana服务的外部IP地址。
control# vi grafana.yaml apiVersion: extensions/v1beta1 kind: Deployment metadata: name: monitoring-grafana namespace: kube-system spec: replicas: 1 template: metadata: labels: task: monitoring k8s-app: grafana spec: containers: - name: grafana image: k8s.gcr.io/heapster-grafana-amd64:v5.0.4 ports: - containerPort: 3000 protocol: TCP volumeMounts: - mountPath: /etc/ssl/certs name: ca-certificates readOnly: true - mountPath: /var name: grafana-storage env: - name: INFLUXDB_HOST value: monitoring-influxdb - name: GF_SERVER_HTTP_PORT value: "3000" # The following env variables are required to make Grafana accessible via # the kubernetes api-server proxy. On production clusters, we recommend # removing these env variables, setup auth for grafana, and expose the grafana # service using a LoadBalancer or a public IP. - name: GF_AUTH_BASIC_ENABLED value: "false" - name: GF_AUTH_ANONYMOUS_ENABLED value: "true" - name: GF_AUTH_ANONYMOUS_ORG_ROLE value: Admin - name: GF_SERVER_ROOT_URL # If you're only using the API Server proxy, set this value instead: # value: /api/v1/namespaces/kube-system/services/monitoring-grafana/proxy value: / volumes: - name: ca-certificates hostPath: path: /etc/ssl/certs - name: grafana-storage emptyDir: {} --- apiVersion: v1 kind: Service metadata: labels: # For use as a Cluster add-on (https://github.com/kubernetes/kubernetes/tree/master/cluster/addons) # If you are NOT using this as an addon, you should comment out this line. kubernetes.io/cluster-service: 'true' kubernetes.io/name: monitoring-grafana name: monitoring-grafana namespace: kube-system spec: # In a production setup, we recommend accessing Grafana through an external Loadbalancer # or through a public IP. # type: LoadBalancer # You could also use NodePort to expose the service at a randomly-generated port # type: NodePort type: LoadBalancer ports: - port: 80 targetPort: 3000 selector: k8s-app: grafana
并创建它们:
control# kubectl create -f influxdb.yaml deployment.extensions/monitoring-influxdb created service/monitoring-influxdb created control# kubectl create -f grafana.yaml deployment.extensions/monitoring-grafana created service/monitoring-grafana created
现在是时候更改heapster部署并向其中添加InfluxDB连接了。 您只需要添加一行:
- --sink=influxdb:http://monitoring-influxdb.kube-system.svc:8086
编辑heapster部署:
control# kubectl get deployments --namespace=kube-system NAME READY UP-TO-DATE AVAILABLE AGE coredns 2/2 2 2 49d heapster 1/1 1 1 2d12h kubernetes-dashboard 1/1 1 1 3d21h monitoring-grafana 1/1 1 1 115s monitoring-influxdb 1/1 1 1 2m18s control# kubectl edit deployment heapster --namespace=kube-system ... beginning bla bla bla spec: containers: - command: - /heapster - --source=kubernetes.summary_api:''?useServiceAccount=true&kubeletHttps=true&kubeletPort=10250&insecure=true - --sink=influxdb:http://monitoring-influxdb.kube-system.svc:8086 image: gcr.io/google_containers/heapster-amd64:v1.4.2 imagePullPolicy: IfNotPresent .... end
现在找到Grafana服务的外部IP地址并登录其中的系统:
control# kubectl get svc --namespace=kube-system NAME TYPE CLUSTER-IP EXTERNAL-IP PORT(S) AGE ..... some other services here monitoring-grafana LoadBalancer 10.98.111.200 192.168.0.241 80:32148/TCP 18m
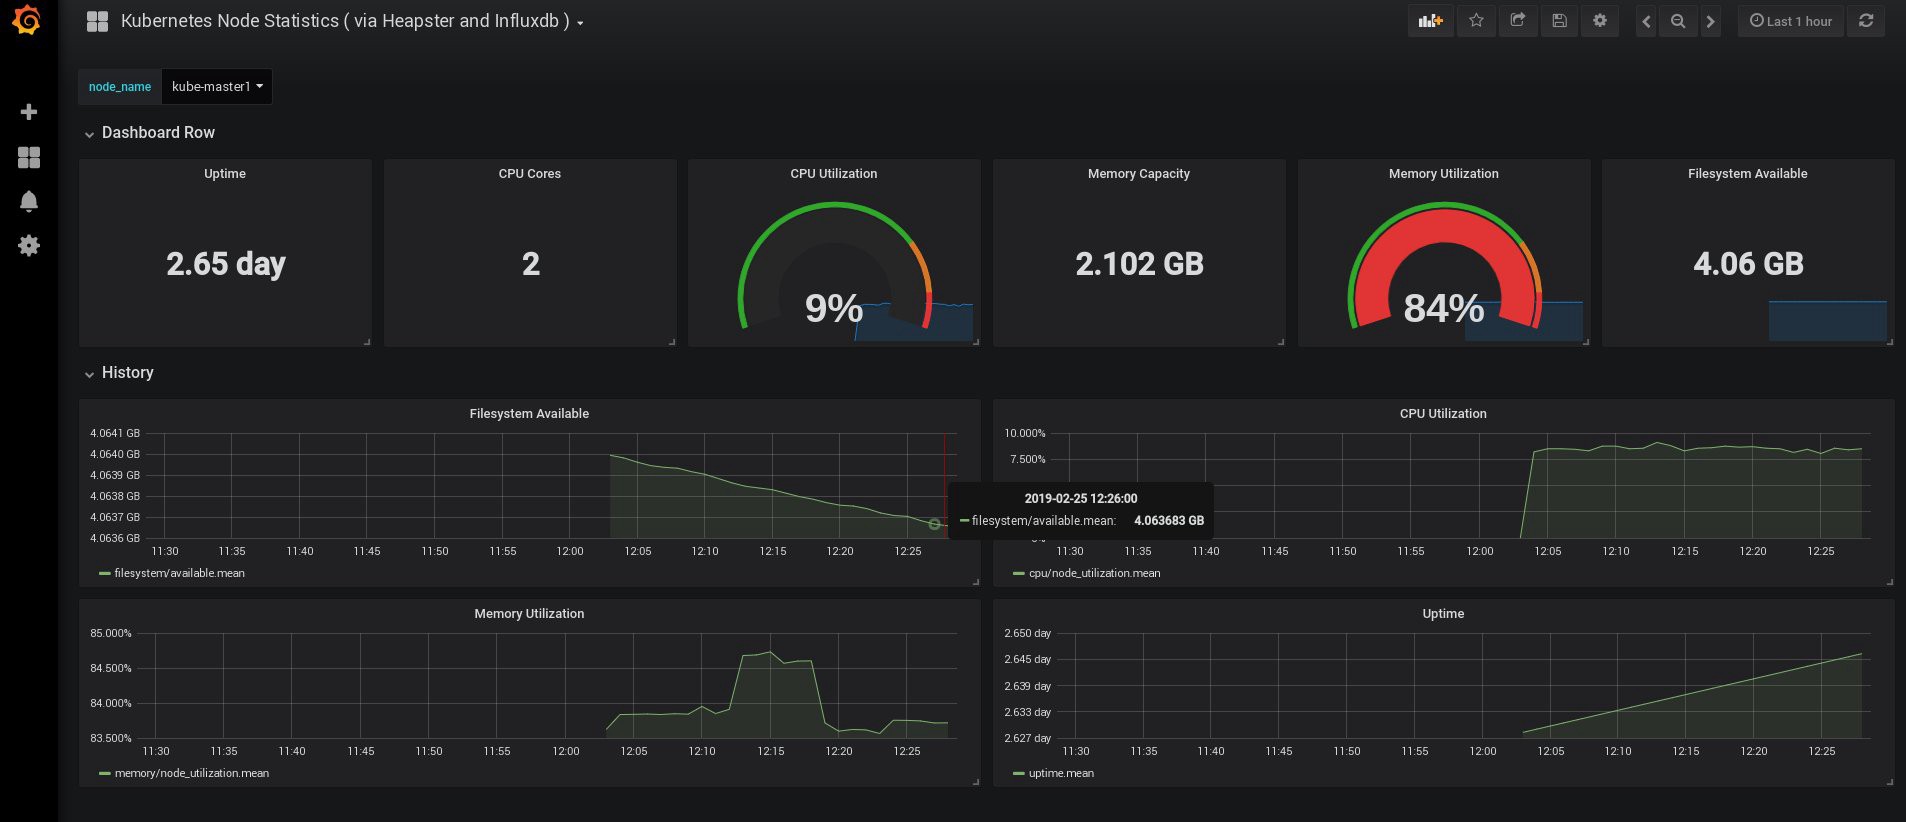
在浏览器中打开http://192.168.0.241 ,首次使用admin / admin凭据:

登录时,我的Grafana是空的,但是幸运的是,我们可以从grafana.com获得所有必要的仪表板。 您需要导入编号为3649和3646的面板。导入时,选择正确的数据源。
之后,监视节点和炉膛资源的使用,当然,还要创建自己的独特仪表板。
好了,现在让我们结束监视。 我们可能需要的以下元素是用于存储应用程序和集群的日志。 有几种方法可以实现这一点,它们都在Kubernetes 文档中进行了描述。 根据我自己的经验,我更喜欢使用Elasticsearch和Kibana服务的外部设置,以及仅使用在每个Kubernetes工作节点上运行的注册代理。 这将保护群集免受与大量日志和其他问题相关的过载的影响,并且即使群集完全完全无法运行,也可以接收日志。
对于Kubernetes爱好者来说,最受欢迎的日志收集堆栈是Elasticsearch,Fluentd和Kibana(EFK堆栈)。 在此示例中,我们将在外部节点(您可以使用现有的ELK堆栈)上运行Elasticsearch和Kibana,并将集群内部的Fluentd作为守护程序作为每个节点的守护程序作为日志收集代理。
我将跳过有关通过Elasticsearch和Kibana安装创建虚拟机的部分。 这是一个相当受欢迎的主题,因此您可以找到许多有关如何最佳实现的材料。 例如,在我的文章中 。 只需从docker -compose.yml文件中删除logstash配置片段 ,并从elasticsearch ports部分中删除127.0.0.1。
在那之后,您应该有一个有效的elasticsearch连接到VM-IP端口:9200。 为了增加安全性,请配置登录:在fluentd和elasticsearch之间通过或安全密钥。 但是,我经常使用iptables规则保护它们。
剩下要做的就是在Kubernetes中创建一个fluentd守护程序集,并在配置中指定elasticsearch 节点:端口外部地址。
我们使用来自此处的yaml配置的官方Kubernetes附加组件,并做了一些小修改:
control# vi fluentd-es-ds.yaml apiVersion: v1 kind: ServiceAccount metadata: name: fluentd-es namespace: kube-system labels: k8s-app: fluentd-es kubernetes.io/cluster-service: "true" addonmanager.kubernetes.io/mode: Reconcile --- kind: ClusterRole apiVersion: rbac.authorization.k8s.io/v1 metadata: name: fluentd-es labels: k8s-app: fluentd-es kubernetes.io/cluster-service: "true" addonmanager.kubernetes.io/mode: Reconcile rules: - apiGroups: - "" resources: - "namespaces" - "pods" verbs: - "get" - "watch" - "list" --- kind: ClusterRoleBinding apiVersion: rbac.authorization.k8s.io/v1 metadata: name: fluentd-es labels: k8s-app: fluentd-es kubernetes.io/cluster-service: "true" addonmanager.kubernetes.io/mode: Reconcile subjects: - kind: ServiceAccount name: fluentd-es namespace: kube-system apiGroup: "" roleRef: kind: ClusterRole name: fluentd-es apiGroup: "" --- apiVersion: apps/v1 kind: DaemonSet metadata: name: fluentd-es-v2.4.0 namespace: kube-system labels: k8s-app: fluentd-es version: v2.4.0 kubernetes.io/cluster-service: "true" addonmanager.kubernetes.io/mode: Reconcile spec: selector: matchLabels: k8s-app: fluentd-es version: v2.4.0 template: metadata: labels: k8s-app: fluentd-es kubernetes.io/cluster-service: "true" version: v2.4.0 # This annotation ensures that fluentd does not get evicted if the node # supports critical pod annotation based priority scheme. # Note that this does not guarantee admission on the nodes (#40573). annotations: scheduler.alpha.kubernetes.io/critical-pod: '' seccomp.security.alpha.kubernetes.io/pod: 'docker/default' spec: priorityClassName: system-node-critical serviceAccountName: fluentd-es containers: - name: fluentd-es image: k8s.gcr.io/fluentd-elasticsearch:v2.4.0 env: - name: FLUENTD_ARGS value: --no-supervisor -q resources: limits: memory: 500Mi requests: cpu: 100m memory: 200Mi volumeMounts: - name: varlog mountPath: /var/log - name: varlibdockercontainers mountPath: /var/lib/docker/containers readOnly: true - name: config-volume mountPath: /etc/fluent/config.d terminationGracePeriodSeconds: 30 volumes: - name: varlog hostPath: path: /var/log - name: varlibdockercontainers hostPath: path: /var/lib/docker/containers - name: config-volume configMap: name: fluentd-es-config-v0.2.0
然后我们将对fluentd进行特定配置:
control# vi fluentd-es-configmap.yaml kind: ConfigMap apiVersion: v1 metadata: name: fluentd-es-config-v0.2.0 namespace: kube-system labels: addonmanager.kubernetes.io/mode: Reconcile data: system.conf: |- <system> root_dir /tmp/fluentd-buffers/ </system> containers.input.conf: |-
@id fluentd-containers.log @type tail path /var/log/containers/*.log pos_file /var/log/es-containers.log.pos tag raw.kubernetes.* read_from_head true <parse> @type multi_format <pattern> format json time_key time time_format %Y-%m-%dT%H:%M:%S.%NZ </pattern> <pattern> format /^(?<time>.+) (?<stream>stdout|stderr) [^ ]* (?<log>.*)$/ time_format %Y-%m-%dT%H:%M:%S.%N%:z </pattern> </parse>
# Detect exceptions in the log output and forward them as one log entry. <match raw.kubernetes.**> @id raw.kubernetes @type detect_exceptions remove_tag_prefix raw message log stream stream multiline_flush_interval 5 max_bytes 500000 max_lines 1000 </match> # Concatenate multi-line logs <filter **> @id filter_concat @type concat key message multiline_end_regexp /\n$/ separator "" </filter> # Enriches records with Kubernetes metadata <filter kubernetes.**> @id filter_kubernetes_metadata @type kubernetes_metadata </filter> # Fixes json fields in Elasticsearch <filter kubernetes.**> @id filter_parser @type parser key_name log reserve_data true remove_key_name_field true <parse> @type multi_format <pattern> format json </pattern> <pattern> format none </pattern> </parse> </filter> output.conf: |- <match **> @id elasticsearch @type elasticsearch @log_level info type_name _doc include_tag_key true host 192.168.1.253 port 9200 logstash_format true <buffer> @type file path /var/log/fluentd-buffers/kubernetes.system.buffer flush_mode interval retry_type exponential_backoff flush_thread_count 2 flush_interval 5s retry_forever retry_max_interval 30 chunk_limit_size 2M queue_limit_length 8 overflow_action block </buffer> </match>
该配置是基本配置,但足以快速入门。 它将收集系统和应用程序日志。 如果您需要更复杂的东西,可以查看有关fluentd插件和Kubernetes配置的官方文档。
现在,让我们在集群中创建一个流畅的守护程序集:
control# kubectl create -f fluentd-es-ds.yaml serviceaccount/fluentd-es created clusterrole.rbac.authorization.k8s.io/fluentd-es created clusterrolebinding.rbac.authorization.k8s.io/fluentd-es created daemonset.apps/fluentd-es-v2.4.0 created control# kubectl create -f fluentd-es-configmap.yaml configmap/fluentd-es-config-v0.2.0 created
确保所有流利的Pod和其他资源都已成功运行,然后打开Kibana。 在Kibana中,找到并添加来自fluentd的新索引。 如果找到了什么,那么说明一切正确,如果没有,请检查前面的步骤并重新创建守护进程或编辑configmap:

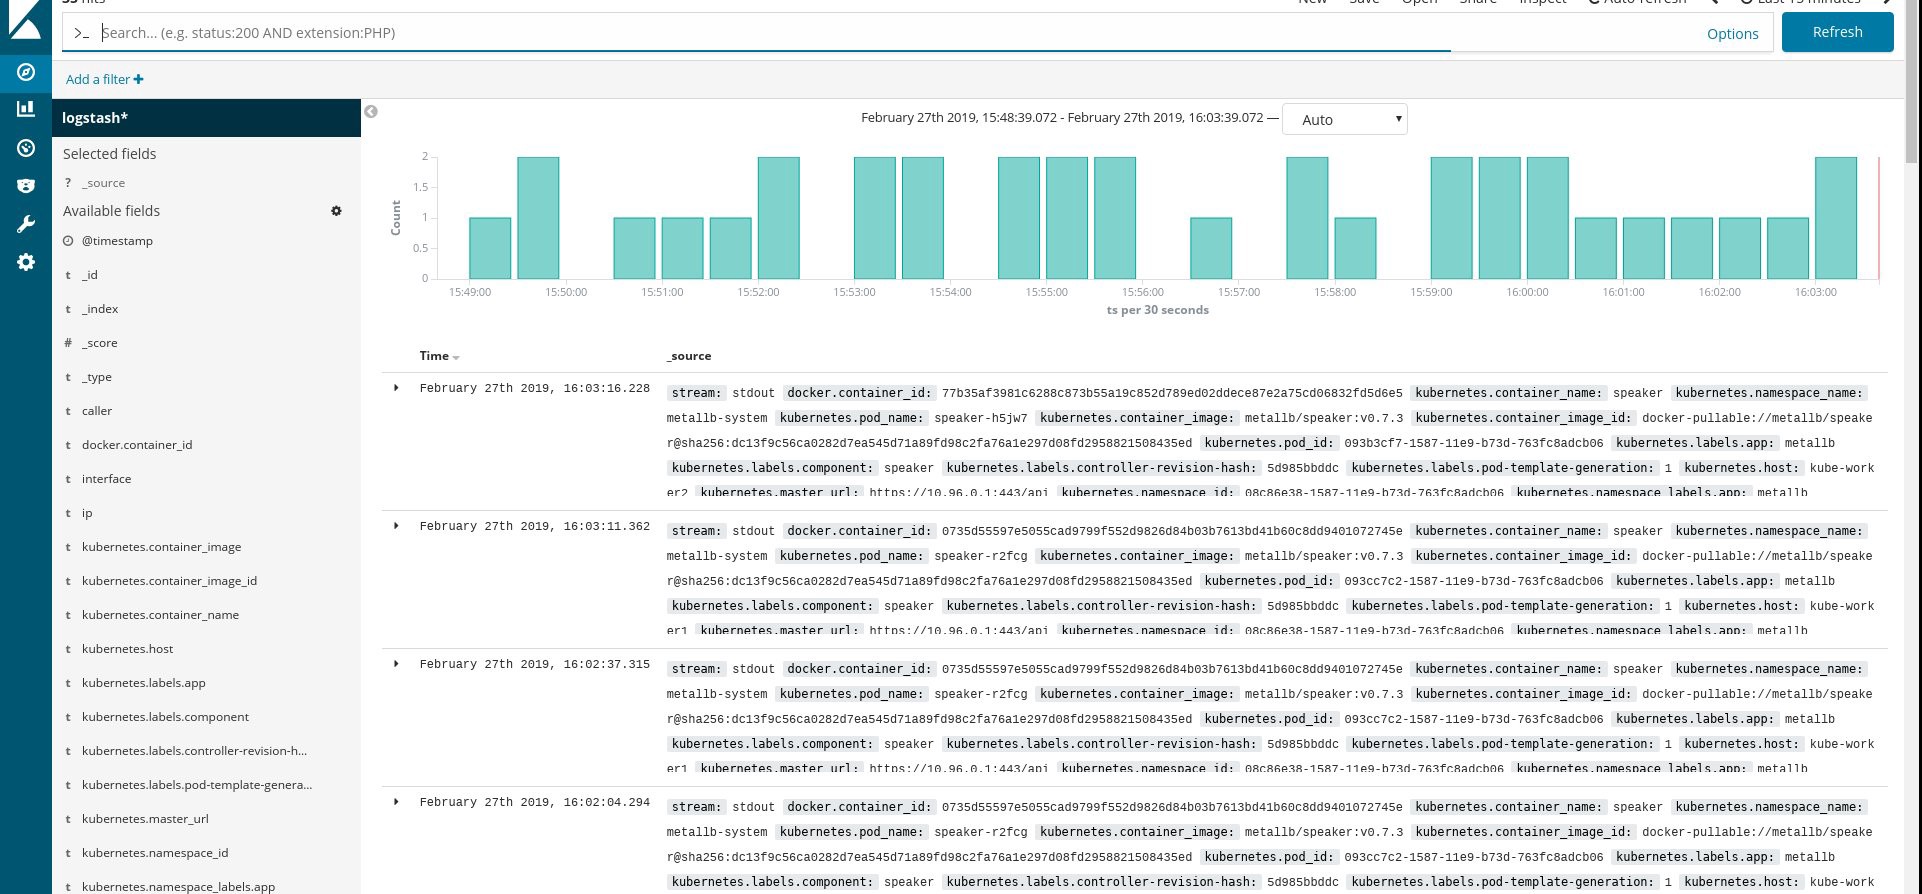
好了,既然我们从集群中获取了日志,就可以创建任何仪表板了。 当然,配置是最简单的,因此您可能需要自行更改。 主要目标是展示如何完成此操作。
完成上述所有步骤后,我们得到了一个非常好的,随时可用的Kubernetes集群。 现在是时候将一些测试应用程序嵌入其中了,看看会发生什么。
对于此示例,请使用我的小型Python / Flask Kubyk应用程序,该应用程序已经具有Docker容器,因此请从docker open注册表中获取它。 现在,我们将向该应用程序添加一个外部数据库文件-为此,我们将使用配置的GlusterFS存储。
首先,我们为此应用程序创建一个新的pvc卷(永久卷请求),我们将在其中存储带有用户凭据的SQLite数据库。 您可以使用本指南第2部分中预先创建的内存类。
control# mkdir kubyk && cd kubyk control# vi kubyk-pvc.yaml kind: PersistentVolumeClaim apiVersion: v1 metadata: name: kubyk annotations: volume.beta.kubernetes.io/storage-class: "slow" spec: accessModes: - ReadWriteOnce resources: requests: storage: 1Gi control# kubectl create -f kubyk-pvc.yaml
为该应用程序创建了新的PVC,我们已准备好进行部署。
control# vi kubyk-deploy.yaml apiVersion: apps/v1 kind: Deployment metadata: name: kubyk-deployment spec: selector: matchLabels: app: kubyk replicas: 1 template: metadata: labels: app: kubyk spec: containers: - name: kubyk image: ratibor78/kubyk ports: - containerPort: 80 volumeMounts: - name: kubyk-db mountPath: /kubyk/sqlite volumes: - name: kubyk-db persistentVolumeClaim: claimName: kubyk control# vi kubyk-service.yaml apiVersion: v1 kind: Service metadata: name: kubyk spec: type: LoadBalancer selector: app: kubyk ports: - port: 80 name: http
现在,让我们创建一个部署和服务:
control# kubectl create -f kubyk-deploy.yaml deployment.apps/kubyk-deployment created control# kubectl create -f kubyk-service.yaml service/kubyk created
检查分配给服务的新IP地址以及子服务器的状态:
control# kubectl get po NAME READY STATUS RESTARTS AGE glusterfs-2wxk7 1/1 Running 1 2d1h glusterfs-5dtdj 1/1 Running 1 41d glusterfs-zqxwt 1/1 Running 0 2d1h heketi-b8c5f6554-f92rn 1/1 Running 0 8d kubyk-deployment-75d5447d46-jrttp 1/1 Running 0 11s control# kubectl get svc NAME TYPE CLUSTER-IP EXTERNAL-IP PORT(S) AGE ... some text.. kubyk LoadBalancer 10.109.105.224 192.168.0.242 80:32384/TCP 10s
因此,看来我们已经成功启动了一个新应用程序。 如果在浏览器中打开IP地址http://192.168.0.242 ,则应该看到该应用程序的登录页面。 您可以使用admin / admin凭据登录,但是如果我们在此阶段尝试登录,则会收到错误消息,因为还没有可用的数据库。
这是Kubernetes仪表板中来自炉膛的日志错误消息的示例:
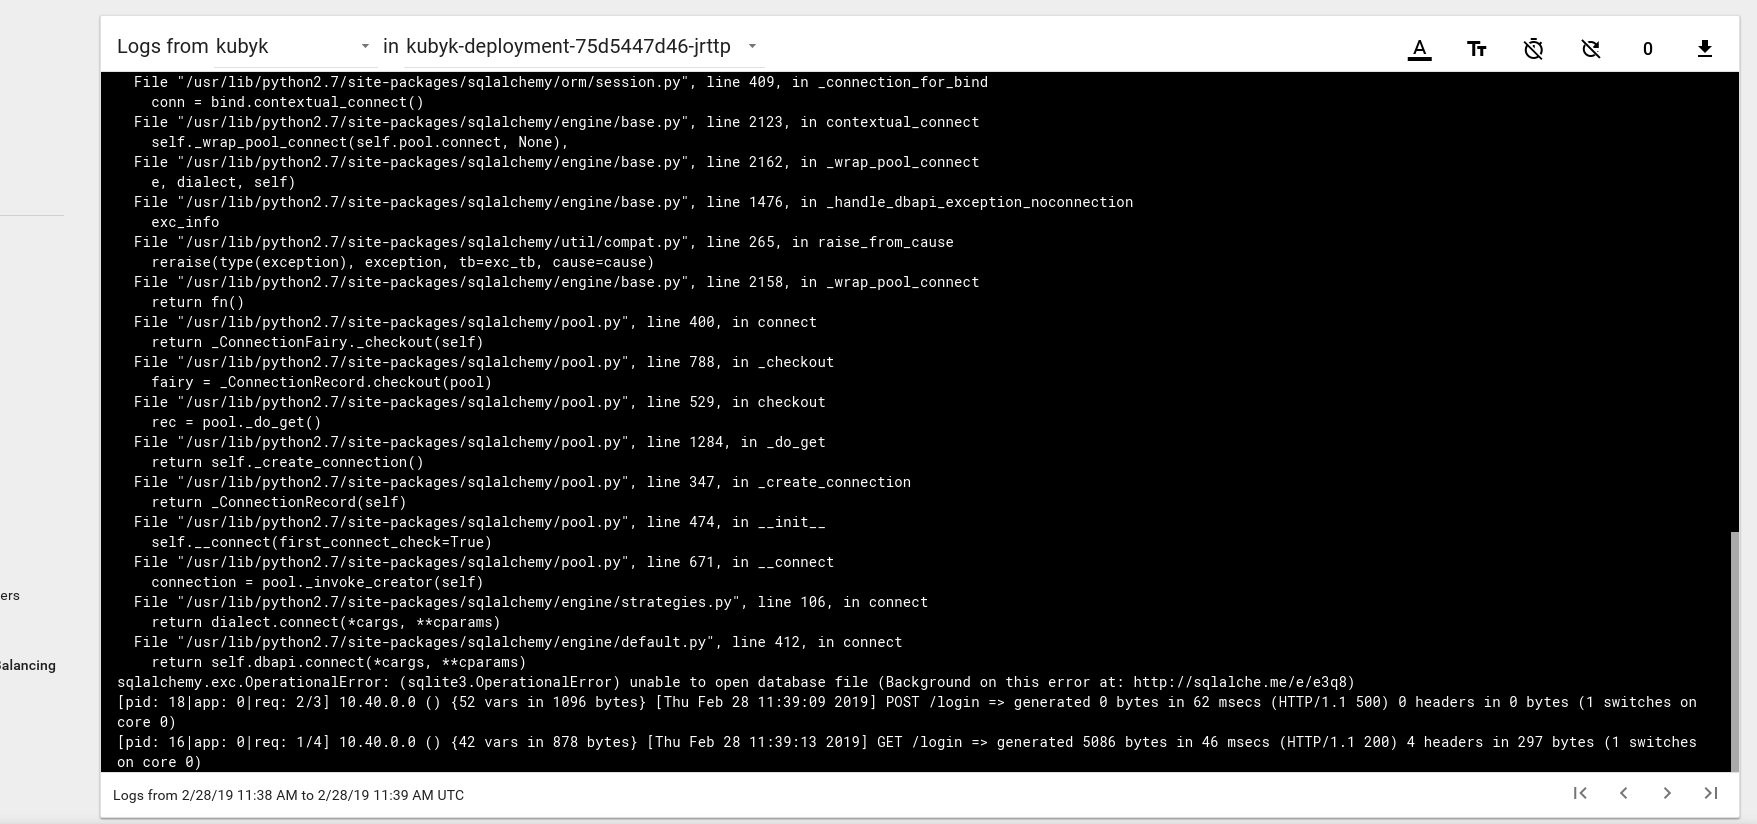
要解决此问题,您需要将SQlite DB文件从我的git存储库复制到先前创建的pvc卷。 该应用程序将开始使用该数据库。
control# git pull https://github.com/ratibor78/kubyk.git control# kubectl cp ./kubyk/sqlite/database.db kubyk-deployment-75d5447d46-jrttp:/kubyk/sqlite
我们使用应用程序中的under和kubectl cp命令将此文件复制到卷中。
您还必须授予nginx用户对该目录的写权限; 我的应用程序是通过使用visitored的nginx用户启动的。
control# kubectl exec -ti kubyk-deployment-75d5447d46-jrttp -- chown -R nginx:nginx /kubyk/sqlite/
让我们尝试再次登录:
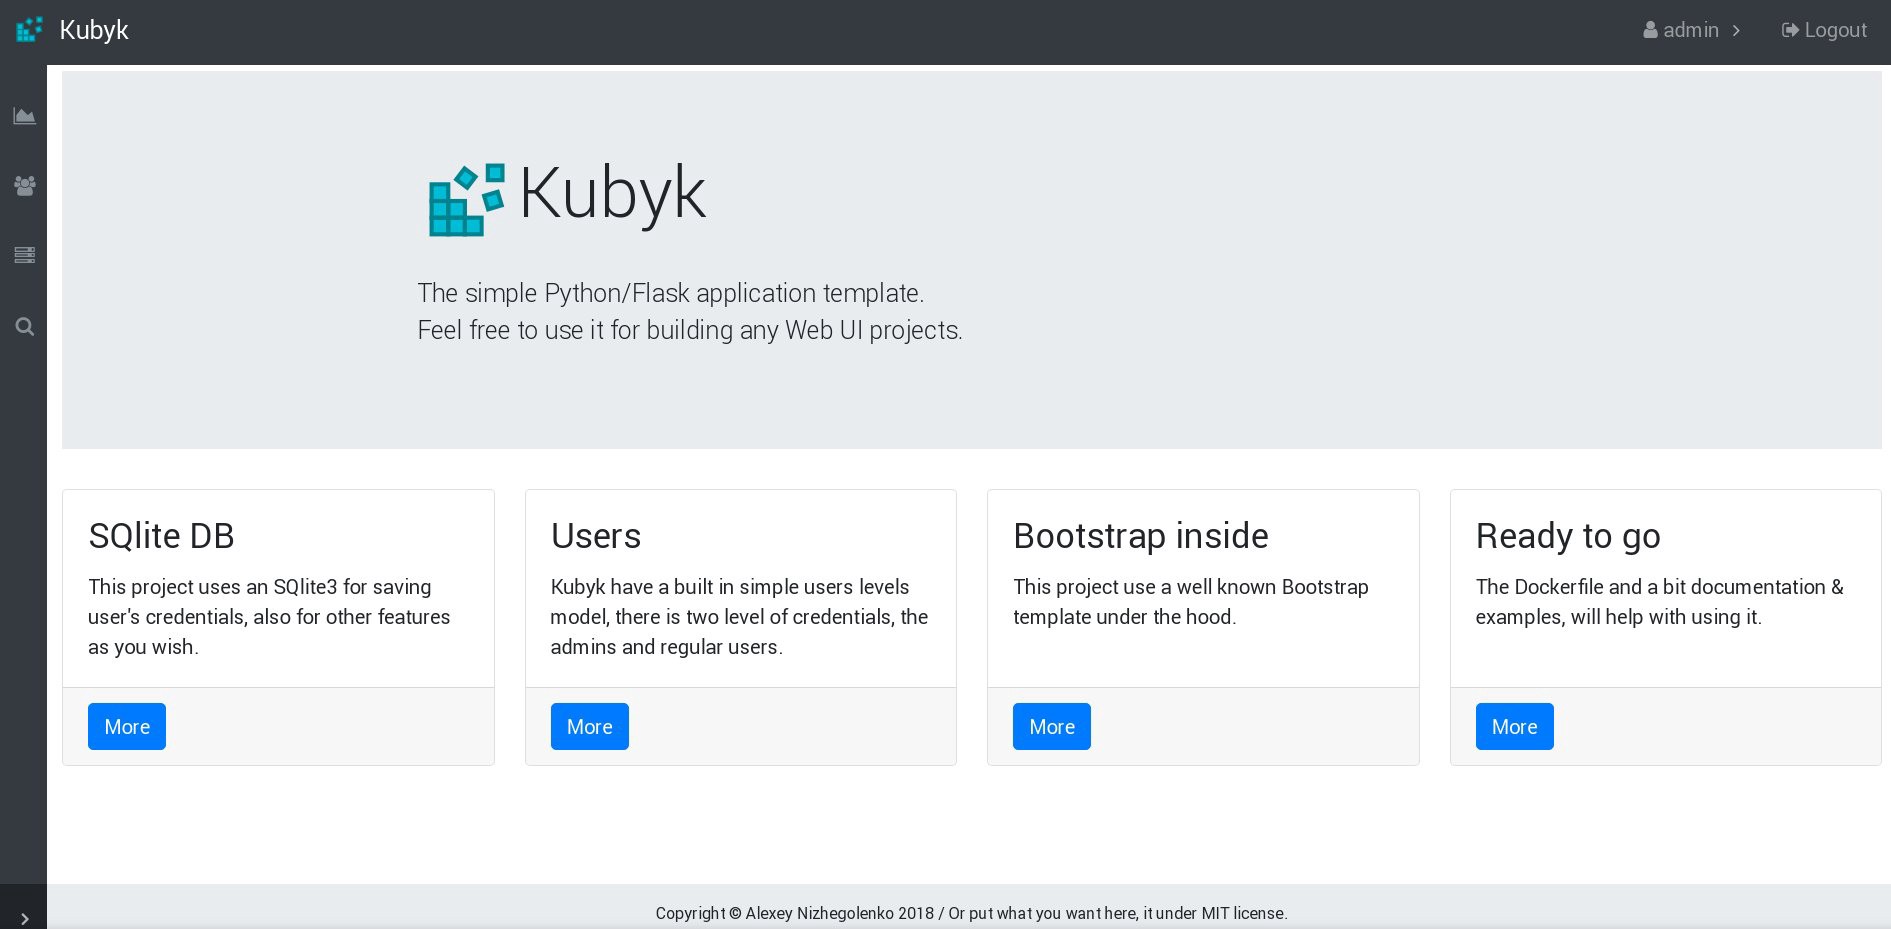
太好了,现在我们的应用程序可以正常工作,并且我们可以将kubyk 部署扩展到3个副本,例如,将应用程序的一个副本放在一个工作节点中。 由于我们之前创建了pvc卷,因此所有带有应用程序副本的pod都将使用相同的数据库,因此该服务将以循环方式在副本之间分配流量。
control# kubectl get deployments NAME READY UP-TO-DATE AVAILABLE AGE heketi 1/1 1 1 39d kubyk-deployment 1/1 1 1 4h5m control# kubectl scale deployments kubyk-deployment --replicas=3 deployment.extensions/kubyk-deployment scaled control# kubectl get po NAME READY STATUS RESTARTS AGE glusterfs-2wxk7 1/1 Running 1 2d5h glusterfs-5dtdj 1/1 Running 21 41d glusterfs-zqxwt 1/1 Running 0 2d5h heketi-b8c5f6554-f92rn 1/1 Running 0 8d kubyk-deployment-75d5447d46-bdnqx 1/1 Running 0 26s kubyk-deployment-75d5447d46-jrttp 1/1 Running 0 4h7m kubyk-deployment-75d5447d46-wz9xz 1/1 Running 0 26s
现在我们为每个工作节点提供了应用程序副本,因此如果丢失任何节点,应用程序将不会停止工作。 另外,正如我之前所说,我们有一种简单的方法来平衡负载。 不错的起点。
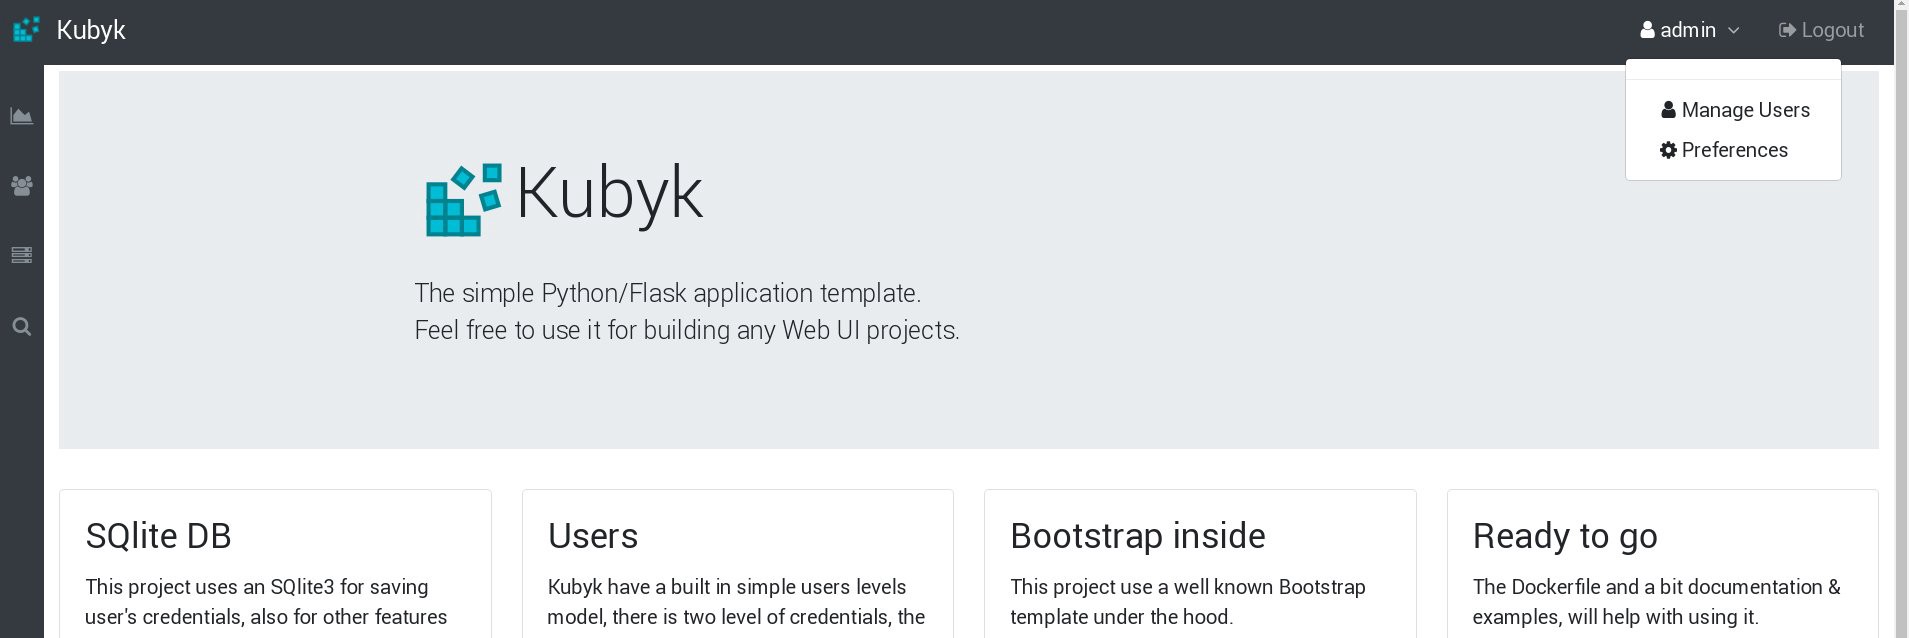
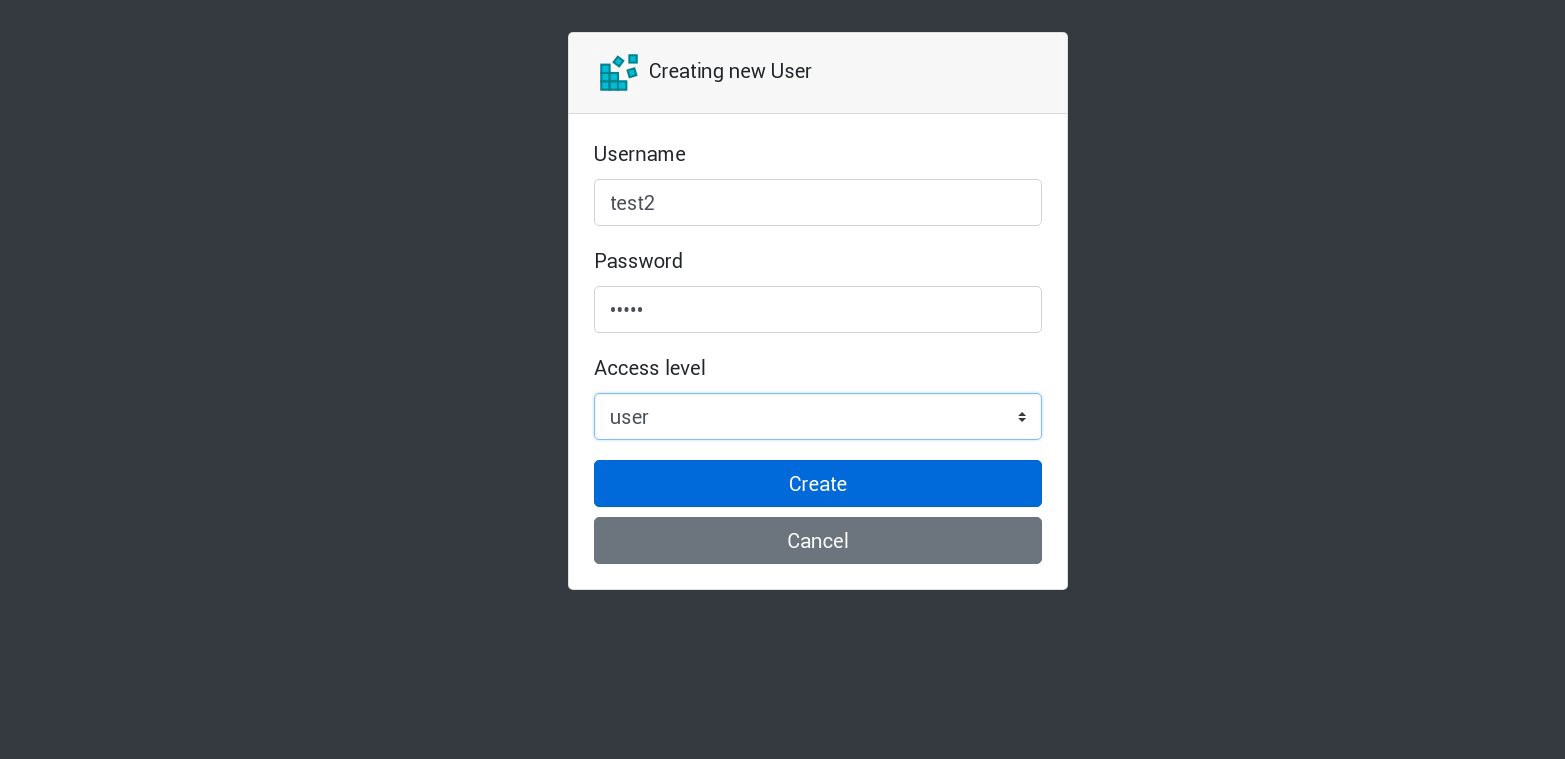
让我们在应用程序中创建一个新用户:
所有新请求将由列表中的下一个壁炉处理。 可以通过炉床日志进行检查。 例如,应用程序在一个子集中创建了一个新用户,然后下一个子群回答了下一个请求,依此类推。 因为此应用程序使用单个永久卷来存储数据库,所以即使丢失了所有副本,所有数据也将是安全的。
在大型和复杂的应用程序中,您不仅需要数据库的指定卷,还需要各种卷来容纳持久性信息和许多其他元素。
好吧,我们快完成了。 您可以添加更多方面,因为Kubernetes是一个庞大而动态的主题,但是我们将在此止步。 本系列文章的主要目的是展示如何创建自己的Kubernetes集群,我希望这些信息对您有用。
聚苯乙烯
当然,稳定性测试和压力测试。
我们的示例中的集群图在没有2个工作节点,1个主节点和1个etcd节点的情况下工作。 如果需要,请禁用它们,然后检查测试应用程序是否可以运行。
在编写这些指南时,我为几乎类似的方案准备了一个生产集群。 一旦创建了集群并将应用程序部署到其中,我就遇到了严重的电源故障; 集群中的所有服务器都绝对被削减-系统管理员的噩梦。 一些服务器关闭了很长时间,然后在它们上发生文件系统错误。 但是重新启动让我非常惊讶:Kubernetes集群完全恢复了。 启动了所有GlusterFS卷和部署。 对我来说,这表明了这项技术的巨大潜力。
祝一切顺利,我希望很快再见!