
不久前,我们为此进行了无代理监视和警报。 这与具有兼容API的AWS中的CloudWatch类似。 现在,我们正在研究平衡器和自动缩放。 但是,尽管我们不提供此类服务,但我们还是通过使用我们的监视和标签(AWS资源标签API)作为简单的服务发现作为数据源,让客户自己完成这项服务。 我们将在本文中展示如何执行此操作。
简单Web服务的最小基础结构的示例:DNS-> 2个均衡器-> 2个后端。 可以将这种基础结构视为容错操作和维护的最低要求。 因此,我们不会再“压缩”该基础架构,例如只剩下一个后端。 但是我想增加后端服务器的数量并减少到两个。 这将是我们的任务。 所有示例都可以在资源库中找到 。
基本基础设施
我们不会详细介绍上述基础结构的配置,只会显示如何创建它。 我们更喜欢使用Terraform部署基础架构。 它有助于快速创建所需的一切(VPC,子网,安全组,VM),并一次又一次地重复此过程。
用于提高基本基础结构的脚本:
主文件variable "ec2_url" {} variable "access_key" {} variable "secret_key" {} variable "region" {} variable "vpc_cidr_block" {} variable "instance_type" {} variable "big_instance_type" {} variable "az" {} variable "ami" {} variable "client_ip" {} variable "material" {} provider "aws" { endpoints { ec2 = "${var.ec2_url}" } skip_credentials_validation = true skip_requesting_account_id = true skip_region_validation = true access_key = "${var.access_key}" secret_key = "${var.secret_key}" region = "${var.region}" } resource "aws_vpc" "vpc" { cidr_block = "${var.vpc_cidr_block}" } resource "aws_subnet" "subnet" { availability_zone = "${var.az}" vpc_id = "${aws_vpc.vpc.id}" cidr_block = "${cidrsubnet(aws_vpc.vpc.cidr_block, 8, 0)}" } resource "aws_security_group" "sg" { name = "auto-scaling" vpc_id = "${aws_vpc.vpc.id}" ingress { from_port = 22 to_port = 22 protocol = "tcp" cidr_blocks = ["0.0.0.0/0"] } ingress { from_port = 80 to_port = 80 protocol = "tcp" cidr_blocks = ["${cidrsubnet(aws_vpc.vpc.cidr_block, 8, 0)}"] } ingress { from_port = 8080 to_port = 8080 protocol = "tcp" cidr_blocks = ["${cidrsubnet(aws_vpc.vpc.cidr_block, 8, 0)}"] } egress { from_port = 0 to_port = 0 protocol = "-1" cidr_blocks = ["0.0.0.0/0"] } } resource "aws_key_pair" "key" { key_name = "auto-scaling-new" public_key = "${var.material}" } resource "aws_instance" "compute" { count = 5 ami = "${var.ami}" instance_type = "${count.index == 0 ? var.big_instance_type : var.instance_type}" key_name = "${aws_key_pair.key.key_name}" subnet_id = "${aws_subnet.subnet.id}" availability_zone = "${var.az}" security_groups = ["${aws_security_group.sg.id}"] } resource "aws_eip" "pub_ip" { instance = "${aws_instance.compute.0.id}" vpc = true } output "awx" { value = "${aws_eip.pub_ip.public_ip}" } output "haproxy_id" { value = ["${slice(aws_instance.compute.*.id, 1, 3)}"] } output "awx_id" { value = "${aws_instance.compute.0.id}" } output "backend_id" { value = ["${slice(aws_instance.compute.*.id, 3, 5)}"] }
现代云的普通用户似乎应该理解此配置中描述的所有实体。 特定于我们的云和特定任务的变量将移至单独的文件-terraform.tfvars:
terraform.tfvars ec2_url = "https://api.cloud.croc.ru" access_key = "project:user@customer" secret_key = "secret-key" region = "croc" az = "ru-msk-vol51" instance_type = "m1.2small" big_instance_type = "m1.large" vpc_cidr_block = "10.10.0.0/16" ami = "cmi-3F5B011E"
启动Terraform:
terraform适用 yes yes | terraform apply -var client_ip="$(curl -s ipinfo.io/ip)/32" -var material="$(cat <ssh_publick_key_path>)"
监控设置
上面启动的VM由我们的云自动监视。 此监视数据将成为将来自动缩放的信息源。 依靠某些指标,我们可以增加或减少功率。
在我们的云中进行监视可以使您根据不同条件针对不同指标配置警报。 非常方便。 我们不需要任何时间间隔分析指标并做出决定-这将通过云监控来完成。 在此示例中,我们将使用警报作为CPU指标,但在我们的监控中,也可以针对以下指标配置警报:网络利用率(速度/ pps),磁盘利用率(速度/ iops)。
cloudwatch put-metric-alarm export CLOUDWATCH_URL=https://monitoring.cloud.croc.ru for instance_id in <backend_instance_ids>; do \ aws --profile <aws_cli_profile> --endpoint-url $CLOUDWATCH_URL \ cloudwatch put-metric-alarm \ --alarm-name "scaling-low_$instance_id" \ --dimensions Name=InstanceId,Value="$instance_id" \ --namespace "AWS/EC2" --metric-name CPUUtilization --statistic Average \ --period 60 --evaluation-periods 3 --threshold 15 --comparison-operator LessThanOrEqualToThreshold; done for instance_id in <backend_instance_ids>; do \ aws --profile <aws_cli_profile> --endpoint-url $CLOUDWATCH_URL \ cloudwatch put-metric-alarm\ --alarm-name "scaling-high_$instance_id" \ --dimensions Name=InstanceId,Value="$instance_id" \ --namespace "AWS/EC2" --metric-name CPUUtilization --statistic Average\ --period 60 --evaluation-periods 3 --threshold 80 --comparison-operator GreaterThanOrEqualToThreshold; done
一些可能难以理解的参数的描述:
--profile-aws-cli设置配置文件,在〜/ .aws / config中描述。 通常,在不同的配置文件中设置不同的访问密钥。
--dimensions-在上面的示例中,该参数确定将针对哪个资源创建警报,该实例的标识符来自变量$ instance_id。
--namespace-从中选择监视指标的名称空间。
--metric-name-监视指标的名称。
--statistic-指标值聚合方法的名称。
--period-监视值收集事件之间的时间间隔。
--evaluation-periods-触发警报所需的时间间隔数。
--threshold-用于评估警报状态的度量标准阈值。
--comparison-operator-一种用于评估相对于阈值的指标值的方法。
在上面的示例中,为每个后端实例创建了两个警报。 当CPU负载小于15%的时间持续3分钟时,Scaling-low- <instance-id>将进入“警报”状态。 当CPU负载超过80%3分钟后,Scaling-high- <instance-id>将进入报警状态。
标签定制
设置监视后,我们面临以下任务-实例及其名称的发现(服务发现)。 我们需要以某种方式了解我们现在已经启动了多少个后端实例,我们还需要知道它们的名称。 例如,在云之外的世界中,领事和领事模板将非常适合生成平衡器配置。 但是我们的云中有标签。 标签将帮助我们对资源进行分类。 通过请求有关特定标记(描述标记)的信息,我们可以了解池中当前有多少个实例以及它们具有什么ID。 默认情况下,唯一的实例ID用作主机名。 由于VPC内部有内部DNS,这些ID /主机名解析为内部IP实例。
我们为后端实例和平衡器设置标签:
ec2创建标签 export EC2_URL="https://api.cloud.croc.ru" aws --profile <aws_cli_profile> --endpoint-url $EC2_URL \ ec2 create-tags --resources "<awx_instance_id>" \ --tags Key=env,Value=auto-scaling Key=role,Value=awx for i in <backend_instance_ids>; do \ aws --profile <aws_cli_profile> --endpoint-url $EC2_URL \ ec2 create-tags --resources "$i" \ --tags Key=env,Value=auto-scaling Key=role,Value=backend ; done; for i in <haproxy_instance_ids>; do \ aws --profile <aws_cli_profile> --endpoint-url $EC2_URL \ ec2 create-tags --resources "$i" \ --tags Key=env,Value=auto-scaling Key=role,Value=haproxy; done;
其中:
--resources-将设置标签的资源标识符的列表。
--tags是键值对的列表。
CROC Cloud 文档中提供了一个示例描述标签。
自动缩放设置
现在云正在监视,并且我们知道如何使用标签,我们只能轮询已配置警报的状态以进行触发。 在这里,我们需要一个实体,该实体将参与定期监视,监视和启动创建/删除实例的任务。 在这里可以应用各种自动化工具。 我们将使用AWX。 AWX是商业Ansible Tower的开源版本,该产品用于集中管理Ansible基础架构。 主要任务是定期启动我们的ansible剧本。
AWX部署的示例可在官方存储库的Wiki页面上找到。 Ansible Tower文档中也描述了AWX配置。 为了使AWX开始运行自定义剧本,您必须通过创建以下实体对其进行配置:
- 三种类型的凭证:
-AWS凭证-授权与CROC云相关的操作。
-机器凭据-用于访问新创建实例的ssh密钥。
-SCM凭证-用于版本控制系统中的授权。 - Project是一个实体,它将从剧本中推送git存储库。
- 脚本-动态清单脚本。
- 库存是一个实体,它将在启动剧本之前调用动态库存脚本。
- 模板-特定剧本调用的配置,由Project的一组凭据,清单和剧本组成。
- 工作流程-对剧本的一系列调用。
自动缩放过程可以分为两个部分:
- scale_up-至少触发一个高警报时创建一个实例;
- scale_down-如果低警报对其起作用,则终止该实例。
作为scale_up部分的一部分,您将需要:
- 向云监视服务询问“警报”状态下是否存在高警报;
- 如果所有高警报都处于“ OK”状态,则提前停止scale_up;
- 创建具有必要属性(标签,子网,security_group等)的新实例;
- 为正在运行的实例创建高低警报;
- 在新实例中配置我们的应用程序(在我们的例子中,它只是带有测试页的nginx);
- 更新haproxy配置,重新加载,以使请求开始进入新实例。
create-instance.yaml --- - name: get alarm statuses describe_alarms: region: "croc" alarm_name_prefix: "scaling-high" alarm_state: "alarm" register: describe_alarms_query - name: stop if no alarms fired fail: msg: zero high alarms in alarm state when: describe_alarms_query.meta | length == 0 - name: create instance ec2: region: "croc" wait: yes state: present count: 1 key_name: "{{ hostvars[groups['tag_role_backend'][0]].ec2_key_name }}" instance_type: "{{ hostvars[groups['tag_role_backend'][0]].ec2_instance_type }}" image: "{{ hostvars[groups['tag_role_backend'][0]].ec2_image_id }}" group_id: "{{ hostvars[groups['tag_role_backend'][0]].ec2_security_group_ids }}" vpc_subnet_id: "{{ hostvars[groups['tag_role_backend'][0]].ec2_subnet_id }}" user_data: | #!/bin/sh sudo yum install epel-release -y sudo yum install nginx -y cat <<EOF > /etc/nginx/conf.d/dummy.conf server { listen 8080; location / { return 200 '{"message": "$HOSTNAME is up"}'; } } EOF sudo systemctl restart nginx loop: "{{ hostvars[groups['tag_role_backend'][0]] }}" register: new - name: create tag entry ec2_tag: ec2_url: "https://api.cloud.croc.ru" region: croc state: present resource: "{{ item.id }}" tags: role: backend loop: "{{ new.instances }}" - name: create low alarms ec2_metric_alarm: state: present region: croc name: "scaling-low_{ item.id }}" metric: "CPUUtilization" namespace: "AWS/EC2" statistic: Average comparison: "<=" threshold: 15 period: 300 evaluation_periods: 3 unit: "Percent" dimensions: {'InstanceId':"{{ item.id }}"} loop: "{{ new.instances }}" - name: create high alarms ec2_metric_alarm: state: present region: croc name: "scaling-high_{{ item.id }}" metric: "CPUUtilization" namespace: "AWS/EC2" statistic: Average comparison: ">=" threshold: 80.0 period: 300 evaluation_periods: 3 unit: "Percent" dimensions: {'InstanceId':"{{ item.id }}"} loop: "{{ new.instances }}"
在create-instance.yaml中,发生的事情是:使用正确的参数创建一个实例,对该实例进行标记并创建必要的警报。 Nginx安装和配置脚本也通过用户数据传递。 用户数据由cloud-init服务处理,该服务可在启动过程中灵活配置实例,而无需借助其他自动化工具。
在update-lb.yaml中,在haproxy实例和重新加载haproxy服务上重新创建/etc/haproxy/haproxy.cfg文件:
update-lb.yaml - name: update haproxy configs template: src: haproxy.cfg.j2 dest: /etc/haproxy/haproxy.cfg - name: add new backend host to haproxy systemd: name: haproxy state: restarted
其中haproxy.cfg.j2是haproxy服务配置文件模板:
haproxy.cfg.j2 # {{ ansible_managed }} global log /dev/log local0 log /dev/log local1 notice chroot /var/lib/haproxy stats timeout 30s user haproxy group haproxy daemon defaults log global mode http option httplog option dontlognull timeout connect 5000 timeout client 50000 timeout server 50000 frontend loadbalancing bind *:80 mode http default_backend backendnodes backend backendnodes balance roundrobin option httpchk HEAD / {% for host in groups['tag_role_backend'] %} server {{hostvars[host]['ec2_id']}} {{hostvars[host]['ec2_private_ip_address']}}:8080 check {% endfor %}
由于选项httpchk选项是在haproxy后端部分中定义的,因此haproxy服务将自动轮询后端实例的状态,并且仅平衡过去运行状况检查之间的流量。
在scale_down部分中,您需要:
- 检查状态低报警;
- 如果在“警报”状态下没有低警报,则过早终止播放;
- 终止所有属于低警报级别的实例;
- 禁止终止最后一对实例,即使它们的警报处于“警报”状态;
- 删除我们从负载均衡器配置中删除的实例。
destroy-instance.yaml - name: look for alarm status describe_alarms: region: "croc" alarm_name_prefix: "scaling-low" alarm_state: "alarm" register: describe_alarms_query - name: count alarmed instances set_fact: alarmed_count: "{{ describe_alarms_query.meta | length }}" alarmed_ids: "{{ describe_alarms_query.meta }}" - name: stop if no alarms fail: msg: no alarms fired when: alarmed_count | int == 0 - name: count all described instances set_fact: all_count: "{{ groups['tag_role_backend'] | length }}" - name: fail if last two instance remaining fail: msg: cant destroy last two instances when: all_count | int == 2 - name: destroy tags for marked instances ec2_tag: ec2_url: "https://api.cloud.croc.ru" region: croc resource: "{{ alarmed_ids[0].split('_')[1] }}" state: absent tags: role: backend - name: destroy instances ec2: region: croc state: absent instance_ids: "{{ alarmed_ids[0].split('_')[1] }}" - name: destroy low alarms ec2_metric_alarm: state: absent region: croc name: "scaling-low_{{ alarmed_ids[0].split('_')[1] }}" - name: destroy high alarms ec2_metric_alarm: state: absent region: croc name: "scaling-high_{{ alarmed_ids[0].split('_')[1] }}"
在destroy-instance.yaml中,删除警报,终止实例及其标签,并检查禁止终止最近实例的条件。
由于删除实例后,与之关联的标签将被推迟删除并且可以再使用一分钟,因此我们在删除实例后显式删除标签。
AWX
设置任务,模板
以下任务集将在AWX中创建必要的实体:
awx-configure.yaml --- - name: Create tower organization tower_organization: name: "scaling-org" description: "scaling-org organization" state: present - name: Add tower cloud credential tower_credential: name: cloud description: croc cloud api creds organization: scaling-org kind: aws state: present username: "{{ croc_user }}" password: "{{ croc_password }}" - name: Add tower github credential tower_credential: name: ghe organization: scaling-org kind: scm state: present username: "{{ ghe_user }}" password: "{{ ghe_password }}" - name: Add tower ssh credential tower_credential: name: ssh description: ssh creds organization: scaling-org kind: ssh state: present username: "ec2-user" ssh_key_data: "{{ lookup('file', 'private.key') }}" - name: Add tower project tower_project: name: "auto-scaling" scm_type: git scm_credential: ghe scm_url: <repo-name> organization: "scaling-org" scm_branch: master state: present - name: create inventory tower_inventory: name: dynamic-inventory organization: "scaling-org" state: present - name: copy inventory script to awx copy: src: "{{ role_path }}/files/ec2.py" dest: /root/ec2.py - name: create inventory source shell: | export SCRIPT=$(tower-cli inventory_script create -n "ec2-script" --organization "scaling-org" --script @/root/ec2.py | grep ec2 | awk '{print $1}') tower-cli inventory_source create --update-on-launch True --credential cloud --source custom --inventory dynamic-inventory -n "ec2-source" --source-script $SCRIPT --source-vars '{"EC2_URL":"api.cloud.croc.ru","AWS_REGION": "croc"}' --overwrite True - name: Create create-instance template tower_job_template: name: "create-instance" job_type: "run" inventory: "dynamic-inventory" credential: "cloud" project: "auto-scaling" playbook: "create-instance.yaml" state: "present" register: create_instance - name: Create update-lb template tower_job_template: name: "update-lb" job_type: "run" inventory: "dynamic-inventory" credential: "ssh" project: "auto-scaling" playbook: "update-lb.yaml" credential: "ssh" state: "present" register: update_lb - name: Create destroy-instance template tower_job_template: name: "destroy-instance" job_type: "run" inventory: "dynamic-inventory" project: "auto-scaling" credential: "cloud" playbook: "destroy-instance.yaml" credential: "ssh" state: "present" register: destroy_instance - name: create workflow tower_workflow_template: name: auto_scaling organization: scaling-org schema: "{{ lookup('template', 'schema.j2')}}" - name: set scheduling shell: | tower-cli schedule create -n "3min" --workflow "auto_scaling" --rrule "DTSTART:$(date +%Y%m%dT%H%M%SZ) RRULE:FREQ=MINUTELY;INTERVAL=3"
上一片段将为每个使用的ansible剧本创建一个模板。 每个模板都使用一组已定义的凭据和清单来配置一个剧本的启动。
要构建用于调用剧本的管道,将允许工作流程模板。 设置自动缩放的工作流程如下:
schema.j2 - failure_nodes: - id: 101 job_template: {{ destroy_instance.id }} success_nodes: - id: 102 job_template: {{ update_lb.id }} id: 103 job_template: {{ create_instance.id }} success_nodes: - id: 104 job_template: {{ update_lb.id }}
上一个模板显示了工作流程图,即 模板执行的顺序。 在此工作流程中,仅在成功完成上一个步骤之后,才执行每个下一个步骤(success_nodes)。 图中显示了工作流程的图形表示:
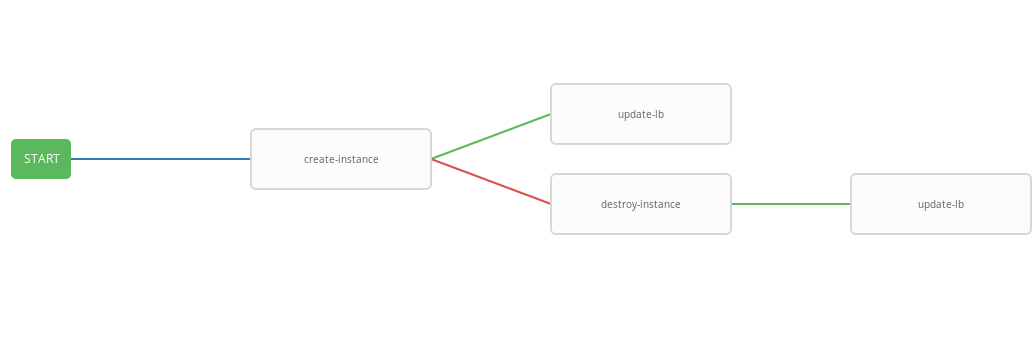
结果,创建了一个通用的工作流,该工作流执行create-instace剧本,并根据执行状态,销毁实例和/或update-lb剧本。 集成的工作流程便于按给定的时间表运行。 自动缩放过程将每三分钟启动一次,根据警报状态启动和终止实例。
工作测试
现在检查配置的系统的操作。 首先,安装用于http基准测试的wrk实用程序。
wrk安装 ssh -A ec2-user@<aws_instance_ip> sudo su - cd /opt yum groupinstall 'Development Tools' yum install -y openssl-devel git git clone https://github.com/wg/wrk.git wrk cd wrk make install wrk /usr/local/bin exit
我们将使用云监视来监视负载期间实例资源的使用:
监控 function CPUUtilizationMonitoring() { local AWS_CLI_PROFILE="<aws_cli_profile>" local CLOUDWATCH_URL="https://monitoring.cloud.croc.ru" local API_URL="https://api.cloud.croc.ru" local STATS="" local ALARM_STATUS="" local IDS=$(aws --profile $AWS_CLI_PROFILE --endpoint-url $API_URL ec2 describe-instances --filter Name=tag:role,Values=backend | grep -i instanceid | grep -oE 'i-[a-zA-Z0-9]*' | tr '\n' ' ') for instance_id in $IDS; do STATS="$STATS$(aws --profile $AWS_CLI_PROFILE --endpoint-url $CLOUDWATCH_URL cloudwatch get-metric-statistics --dimensions Name=InstanceId,Value=$instance_id --namespace "AWS/EC2" --metric CPUUtilization --end-time $(date --iso-8601=minutes) --start-time $(date -d "$(date --iso-8601=minutes) - 1 min" --iso-8601=minutes) --period 60 --statistics Average | grep -i average)"; ALARMS_STATUS="$ALARMS_STATUS$(aws --profile $AWS_CLI_PROFILE --endpoint-url $CLOUDWATCH_URL cloudwatch describe-alarms --alarm-names scaling-high-$instance_id | grep -i statevalue)" done echo $STATS | column -s ',' -o '|' -N $(echo $IDS | tr ' ' ',') -t echo $ALARMS_STATUS | column -s ',' -o '|' -N $(echo $IDS | tr ' ' ',') -t } export -f CPUUtilizationMonitoring watch -n 60 bash -c CPUUtilizationMonitoring
前一个脚本每60秒一次获取有关最后一分钟的CPUUtilization指标平均值的信息,并轮询后端实例的警报状态。
现在,您可以运行wrk并查看负载下的后端实例的资源利用率:
运行 ssh -A ec2-user@<awx_instance_ip> wrk -t12 -c100 -d500s http://<haproxy_instance_id> exit
最后一条命令将使用12个线程并打开100个http连接来启动基准测试500秒。
随着时间的流逝,监视脚本应显示在基准测试期间,CPUUtilization指标的统计信息值会增加,直到达到300%。 基准测试开始后180秒,StateValue标志应切换到“警报”状态。 每两分钟一次,自动缩放工作流程开始。 默认情况下,禁止并行执行同一工作流程。 也就是说,每两分钟,将执行工作流程的任务添加到队列中,并且仅在前一个任务完成后才启动。 因此,当wrk运行时,资源将不断增加,直到所有后端实例的高警报进入OK状态为止。 完成后,wrk scale_down工作流程将终止除两个后端实例之外的所有实例。
监视脚本的示例输出:
监测结果 # start test i-43477460 |i-AC5D9EE0 "Average": 0.0 | "Average": 0.0 i-43477460 |i-AC5D9EE0 "StateValue": "ok"| "StateValue": "ok" # start http load i-43477460 |i-AC5D9EE0 "Average": 267.0 | "Average": 111.0 i-43477460 |i-AC5D9EE0 "StateValue": "ok"| "StateValue": "ok" # alarm state i-43477460 |i-AC5D9EE0 "Average": 267.0 | "Average": 282.0 i-43477460 |i-AC5D9EE0 "StateValue": "alarm"| "StateValue": "alarm" # two new instances created i-1E399860 |i-F307FB00 |i-43477460 |i-AC5D9EE0 "Average": 185.0 | "Average": 215.0 | "Average": 245.0 | i-1E399860 |i-F307FB00 |i-43477460 |i-AC5D9EE0 "StateValue": "insufficient_data"| "StateValue": "insufficient_data"| "StateValue": "alarm"| "StateValue": "alarm" # only two instances left after load has been stopped i-935BAB40 |i-AC5D9EE0 "Average": 0.0 | "Average": 0.0 i-935BAB40 |i-AC5D9EE0 "StateValue": "ok"| "StateValue": "ok"
同样在CROC Cloud中,您可以在相应选项卡的实例页面上查看监视帖子中使用的图形。
查看警报可在“警报”选项卡的“监视”页面上找到。
结论
自动缩放是一种非常流行的方案,但是不幸的是,它尚未出现在我们的云中(但仅在现在)。 但是,我们有许多强大的API可以使用流行的,几乎标准的工具(例如Terraform,ansible,aws-cli等)来执行类似操作以及许多其他操作。