本文将讨论nginx-log-collector项目,该项目将读取nginx日志并将其发送到Clickhouse集群。 通常对于日志,请使用ElasticSearch。 Clickhouse需要较少的资源(磁盘空间,RAM,CPU)。 Clickhouse可以更快地记录数据。 Clickhouse压缩数据,使磁盘数据更加紧凑。 从报告中的2张幻灯片中可以看出Clickhouse的优势, VK如何将数据从数万台服务器插入ClickHouse。


要查看日志分析,请为Grafana创建仪表板。
谁在乎,欢迎来猫。
以标准方式安装nginx,grafana。
使用Denis Proskurin的ansible-playbook安装Clickhouse集群。
在Clickhouse中创建数据库和表
该文件描述了在Clickhouse中为nginx-log-collector创建数据库和表的SQL查询。
我们依次在Clickhouse群集的每个服务器上发出每个请求。
重要说明。 在这一行中,应该将“ logs_cluster”替换为“ remote_servers”和“ shard”之间的clickhouse_remote_servers.xml文件中的集群名称。
ENGINE = Distributed('logs_cluster', 'nginx', 'access_log_shard', rand())
安装和配置nginx-log-collector-rpm
Nginx日志收集器没有rpm。 在这里https://github.com/patsevanton/nginx-log-collector-rpm为此创建rpm。 Rpm将使用Fedora Copr收集
安装rpm软件包nginx-log-collector-rpm
yum -y install yum-plugin-copr yum copr enable antonpatsev/nginx-log-collector-rpm yum -y install nginx-log-collector systemctl start nginx-log-collector
编辑配置/etc/nginx-log-collector/config.yaml:
....... upload: table: nginx.access_log dsn: http://ip---clickhouse:8123/ - tag: "nginx_error:" format: error # access | error buffer_size: 1048576 upload: table: nginx.error_log dsn: http://ip---clickhouse:8123/
Nginx设置
常规Nginx配置:
user nginx; worker_processes auto;
虚拟主机是其中之一:
vhost1.conf:
upstream backend { server ip----stub_http_server:8080; server ip----stub_http_server:8080; server ip----stub_http_server:8080; server ip----stub_http_server:8080; server ip----stub_http_server:8080; } server { listen 80; server_name vhost1; location / { proxy_pass http://backend; } }
将虚拟主机添加到/ etc / hosts文件:
ip----nginx vhost1
HTTP服务器模拟器
作为HTTP服务器仿真器,我们将使用Maxim Ignatenko的 nodejs-stub-server
Nodejs-stub-server没有rpm。 在这里https://github.com/patsevanton/nodejs-stub-server为此创建rpm。 Rpm将使用Fedora Copr收集
在上游nginx rpm上安装nodejs-stub-server软件包
yum -y install yum-plugin-copr yum copr enable antonpatsev/nodejs-stub-server yum -y install stub_http_server systemctl start stub_http_server
负载测试
使用Apache基准测试完成。
安装它:
yum install -y httpd-tools
我们开始使用来自5种不同服务器的Apache基准测试:
while true; do ab -H "User-Agent: 1server" -c 10 -n 10 -t 10 http://vhost1/; sleep 1; done while true; do ab -H "User-Agent: 2server" -c 10 -n 10 -t 10 http://vhost1/; sleep 1; done while true; do ab -H "User-Agent: 3server" -c 10 -n 10 -t 10 http://vhost1/; sleep 1; done while true; do ab -H "User-Agent: 4server" -c 10 -n 10 -t 10 http://vhost1/; sleep 1; done while true; do ab -H "User-Agent: 5server" -c 10 -n 10 -t 10 http://vhost1/; sleep 1; done
Grafana设置
在Grafana官方网站上,您将找不到仪表板。
因此,我们会上交。
您可以在此处找到我保存的仪表板。
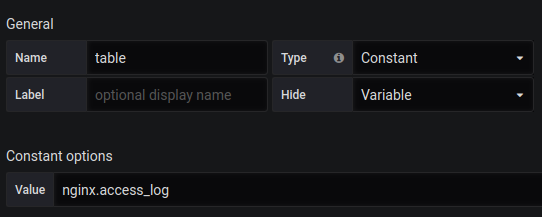
您还需要使用nginx.access_log的内容创建一个表变量。
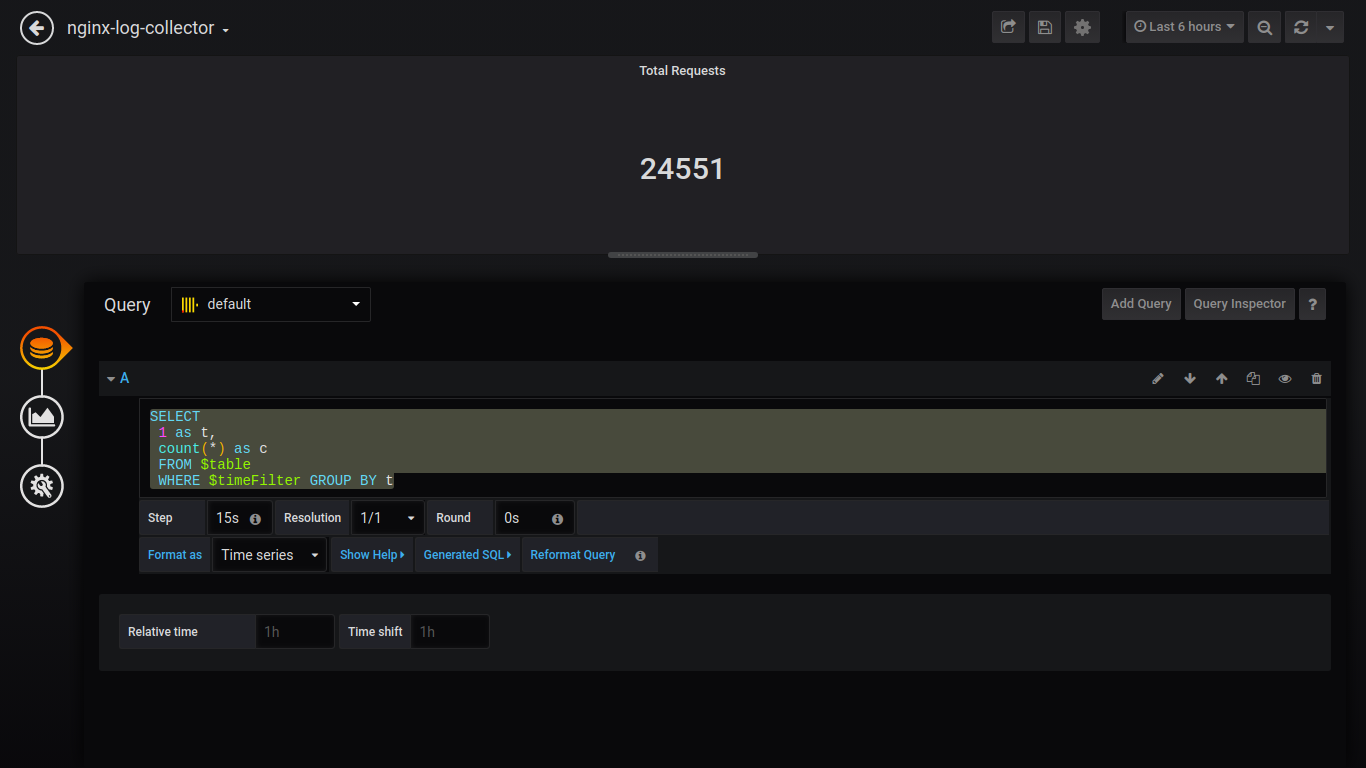
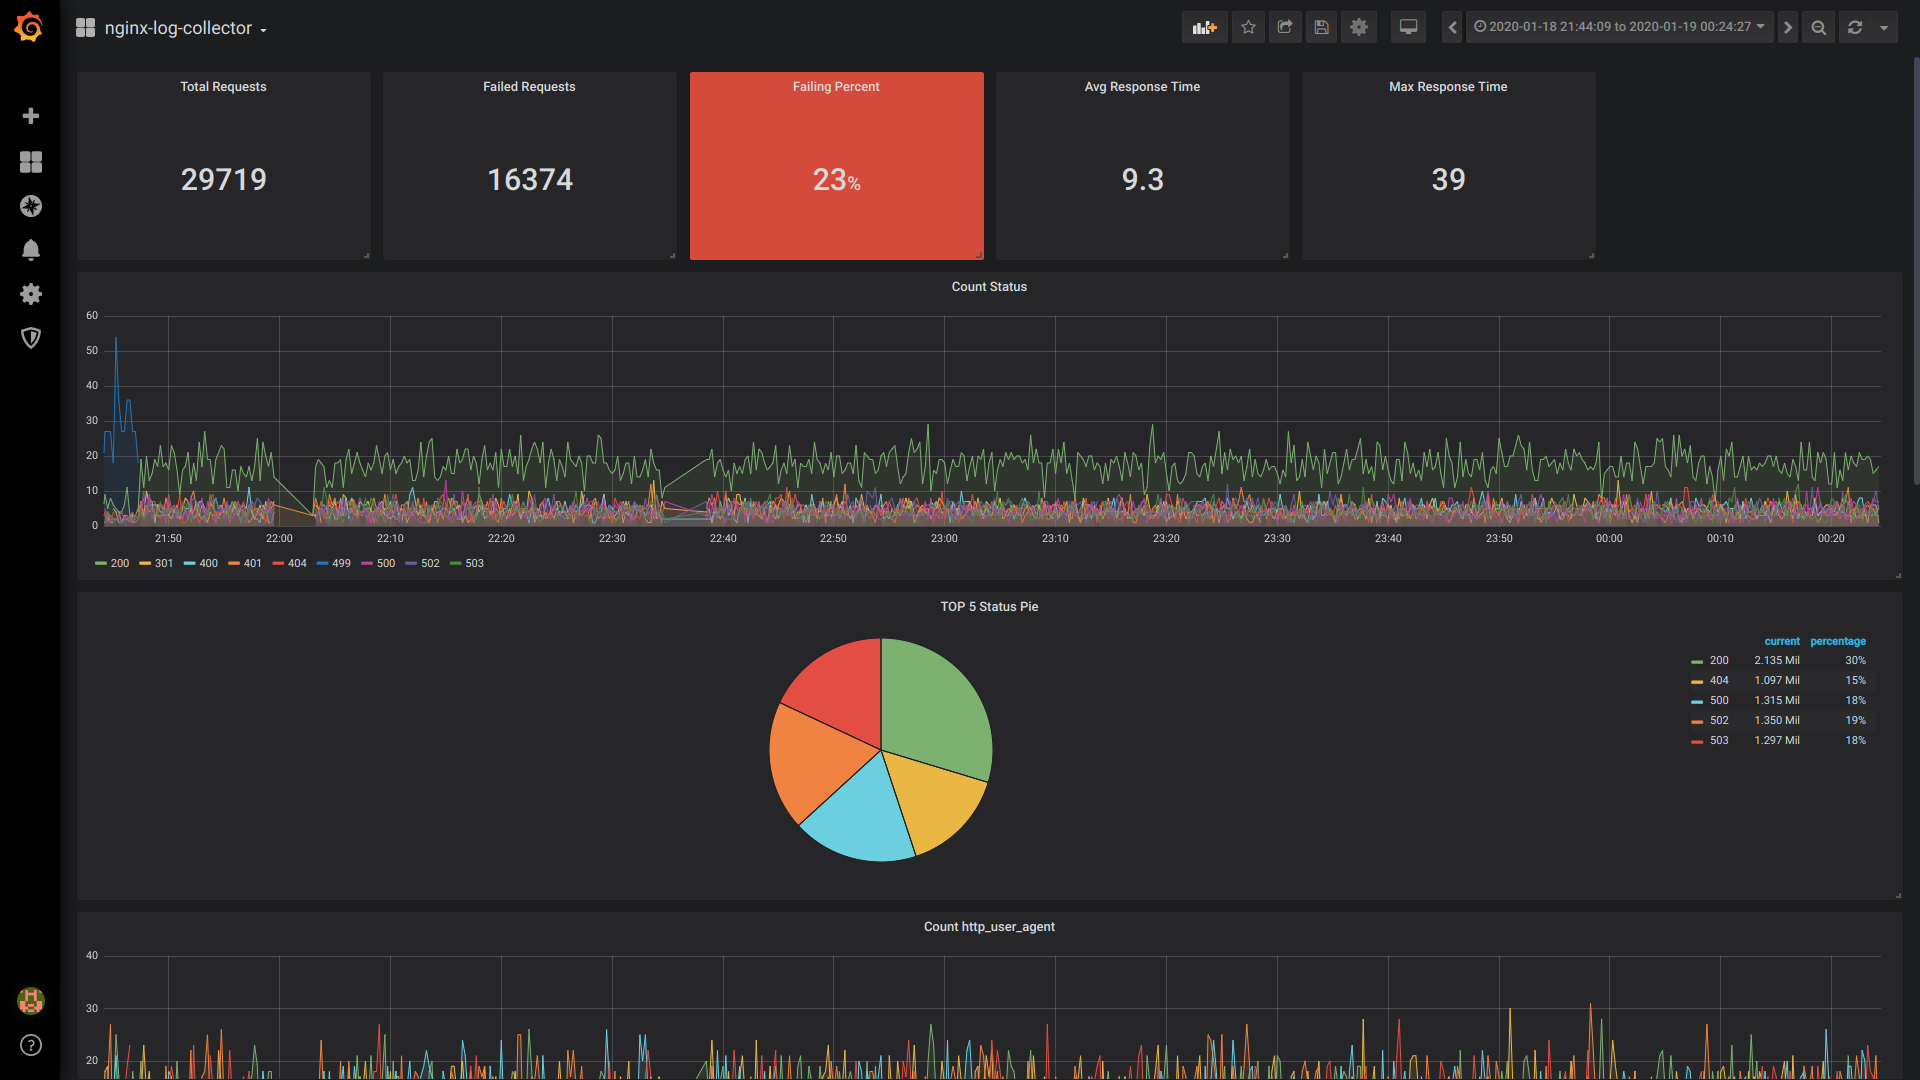
Singlestat总请求数:
SELECT 1 as t, count(*) as c FROM $table WHERE $timeFilter GROUP BY t
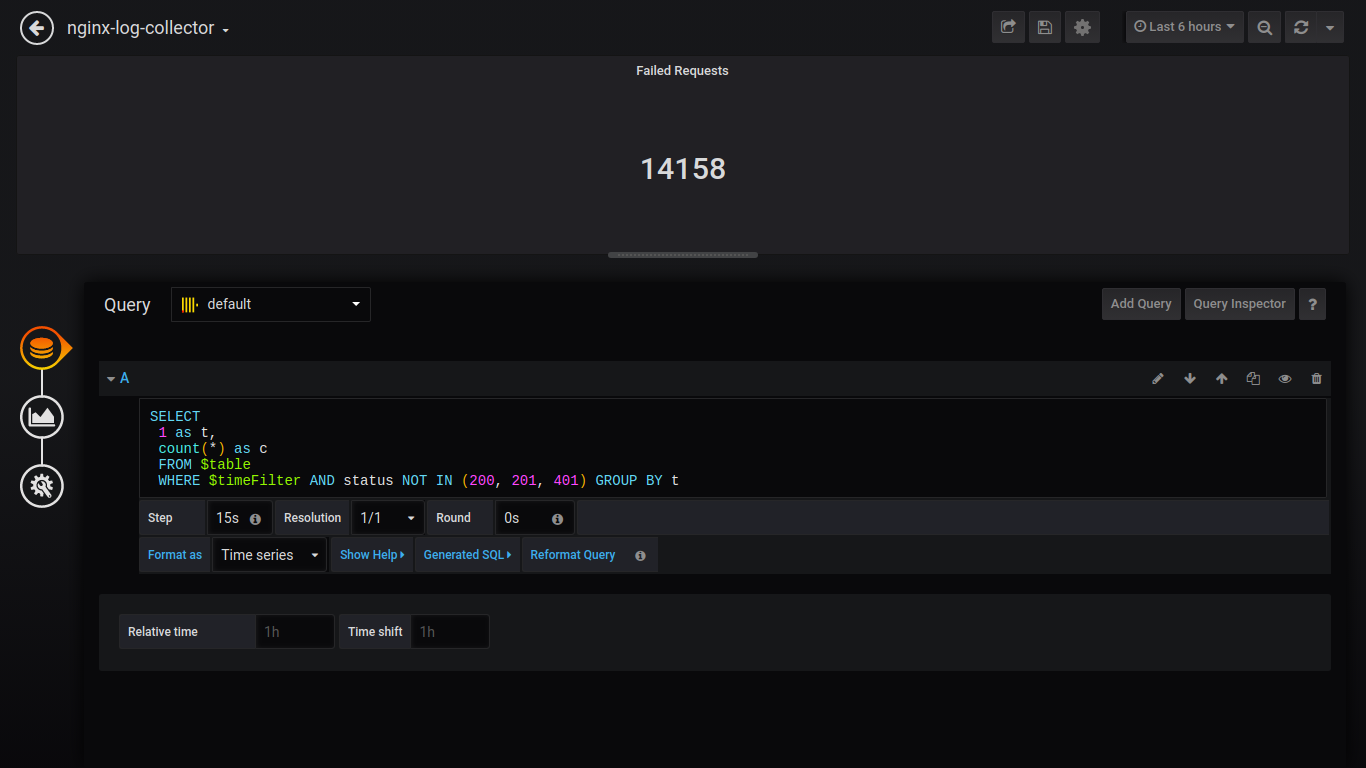
Singlestat失败的请求:
SELECT 1 as t, count(*) as c FROM $table WHERE $timeFilter AND status NOT IN (200, 201, 401) GROUP BY t
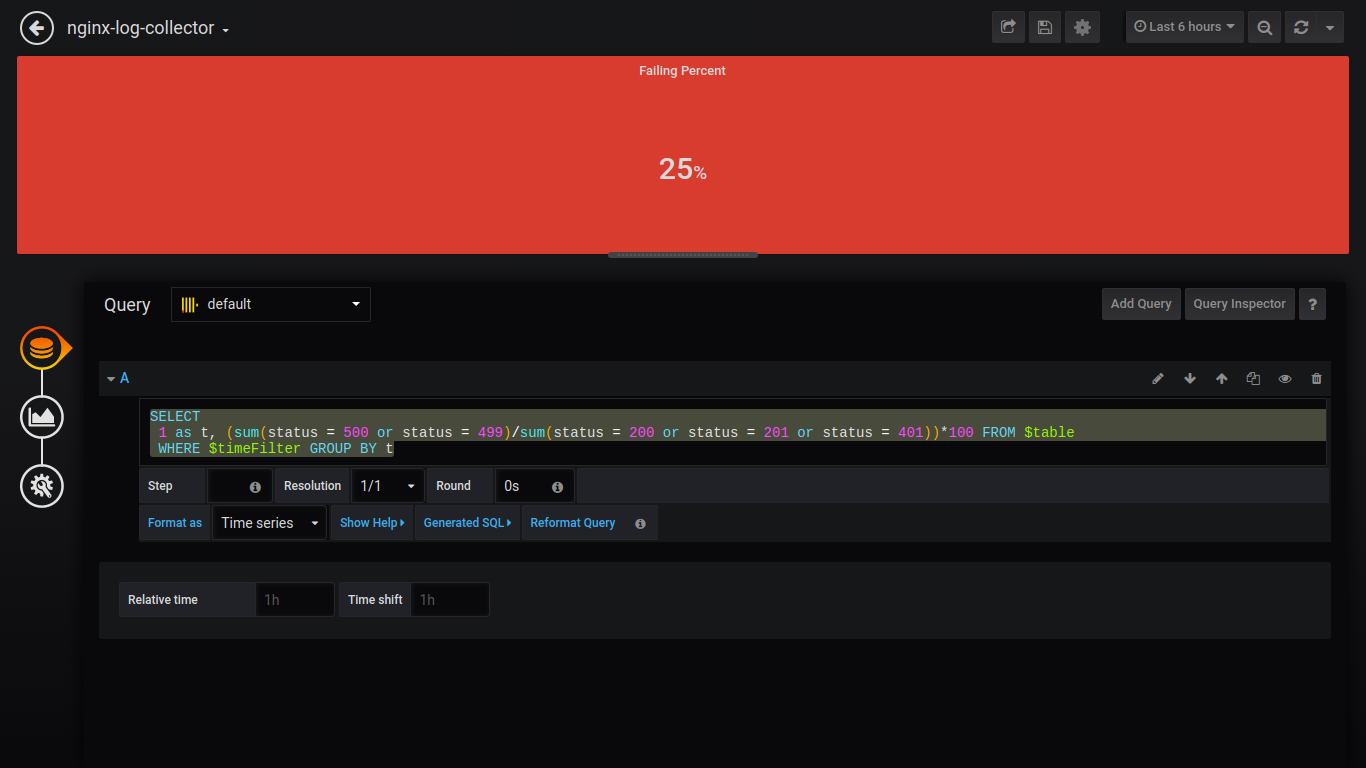
Singlestat失败百分比:
SELECT 1 as t, (sum(status = 500 or status = 499)/sum(status = 200 or status = 201 or status = 401))*100 FROM $table WHERE $timeFilter GROUP BY t
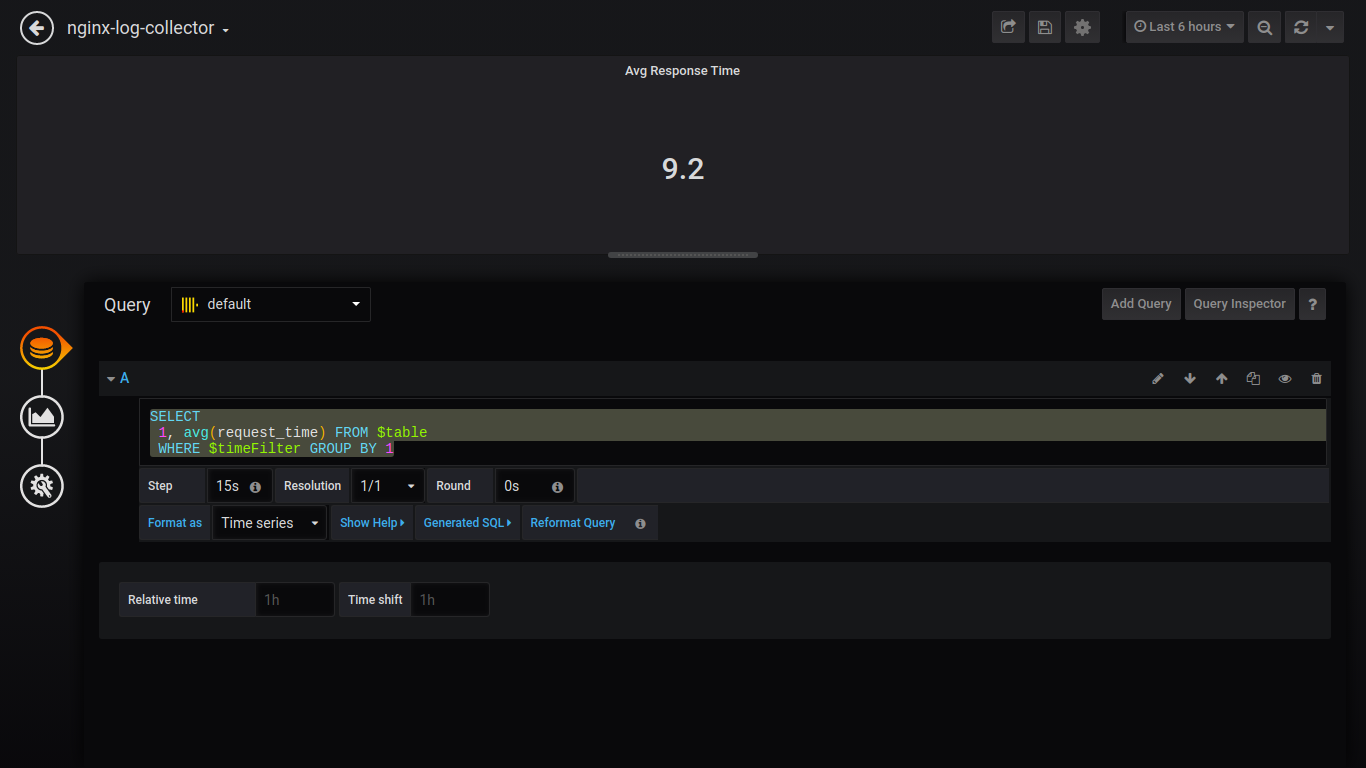
Singlestat平均响应时间:
SELECT 1, avg(request_time) FROM $table WHERE $timeFilter GROUP BY 1
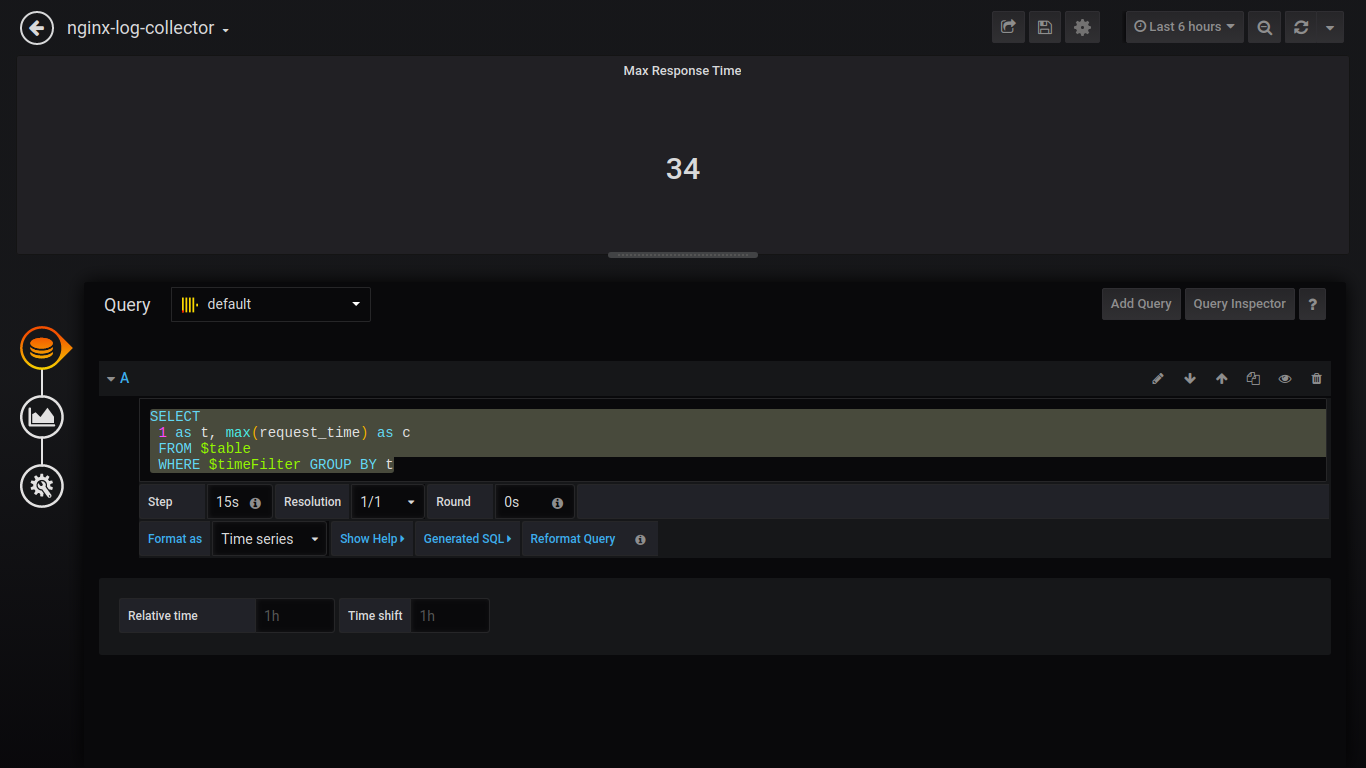
Singlestat最大响应时间:
SELECT 1 as t, max(request_time) as c FROM $table WHERE $timeFilter GROUP BY t
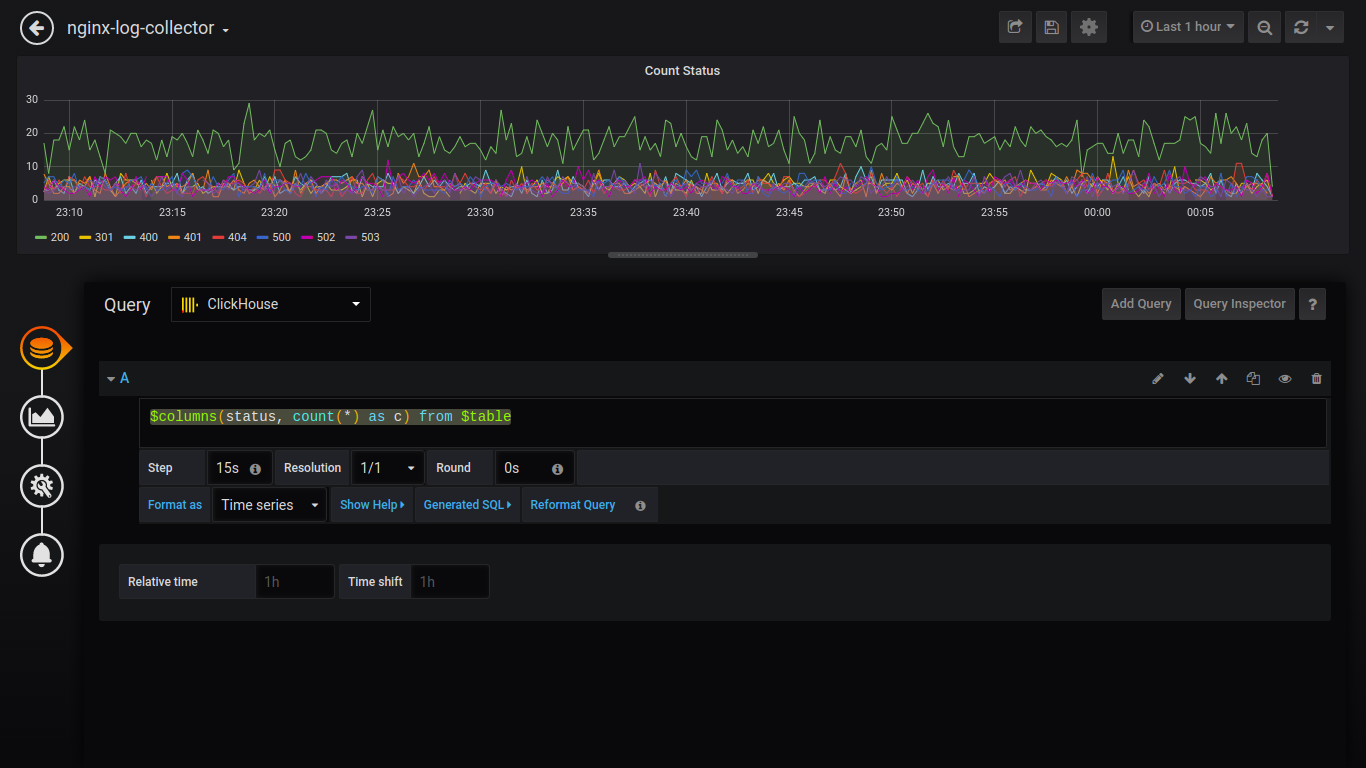
计数状态:
$columns(status, count(*) as c) from $table
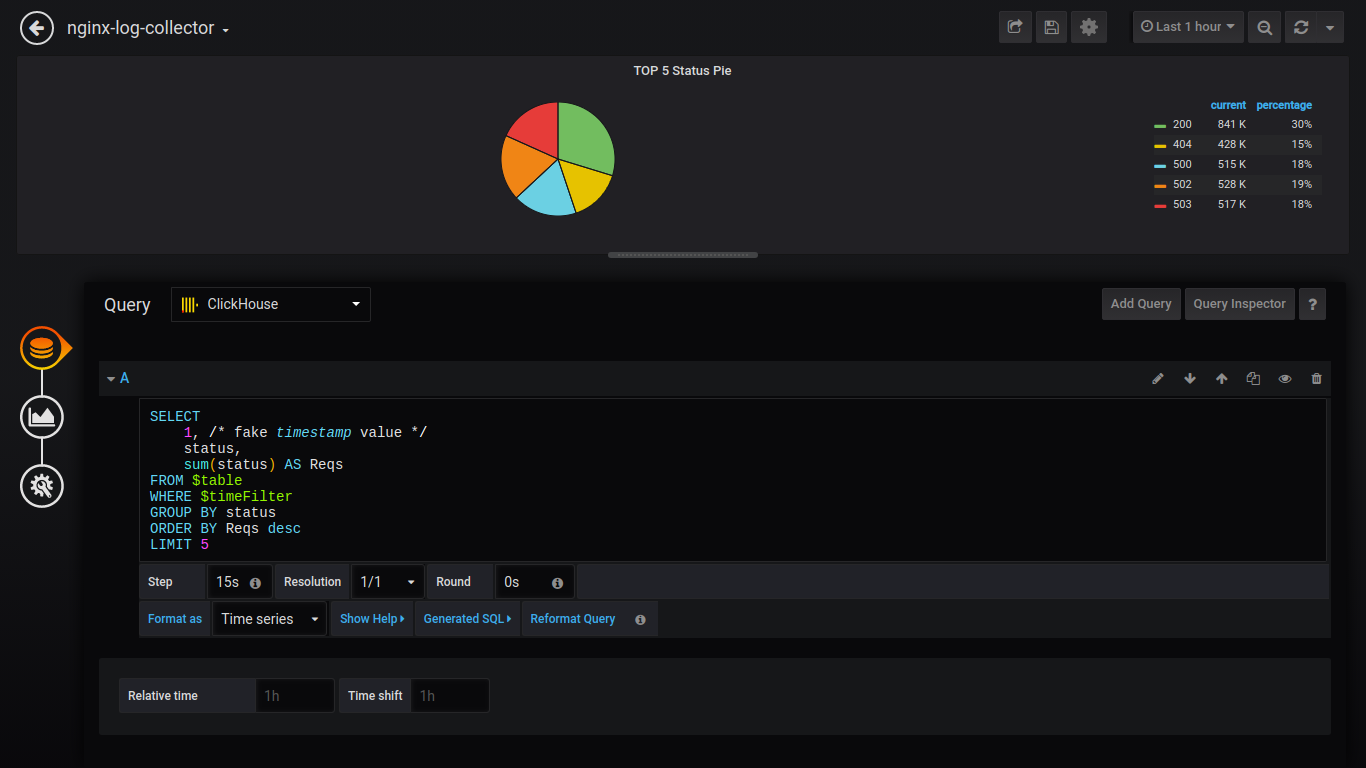
要将数据输出为饼图,您需要安装插件并重新启动grafana。
grafana-cli plugins install grafana-piechart-panel service grafana-server restart
Pie TOP 5状态:
SELECT 1, status, sum(status) AS Reqs FROM $table WHERE $timeFilter GROUP BY status ORDER BY Reqs desc LIMIT 5
此外,我将提供没有屏幕截图的请求:
计数http_user_agent:
$columns(http_user_agent, count(*) c) FROM $table
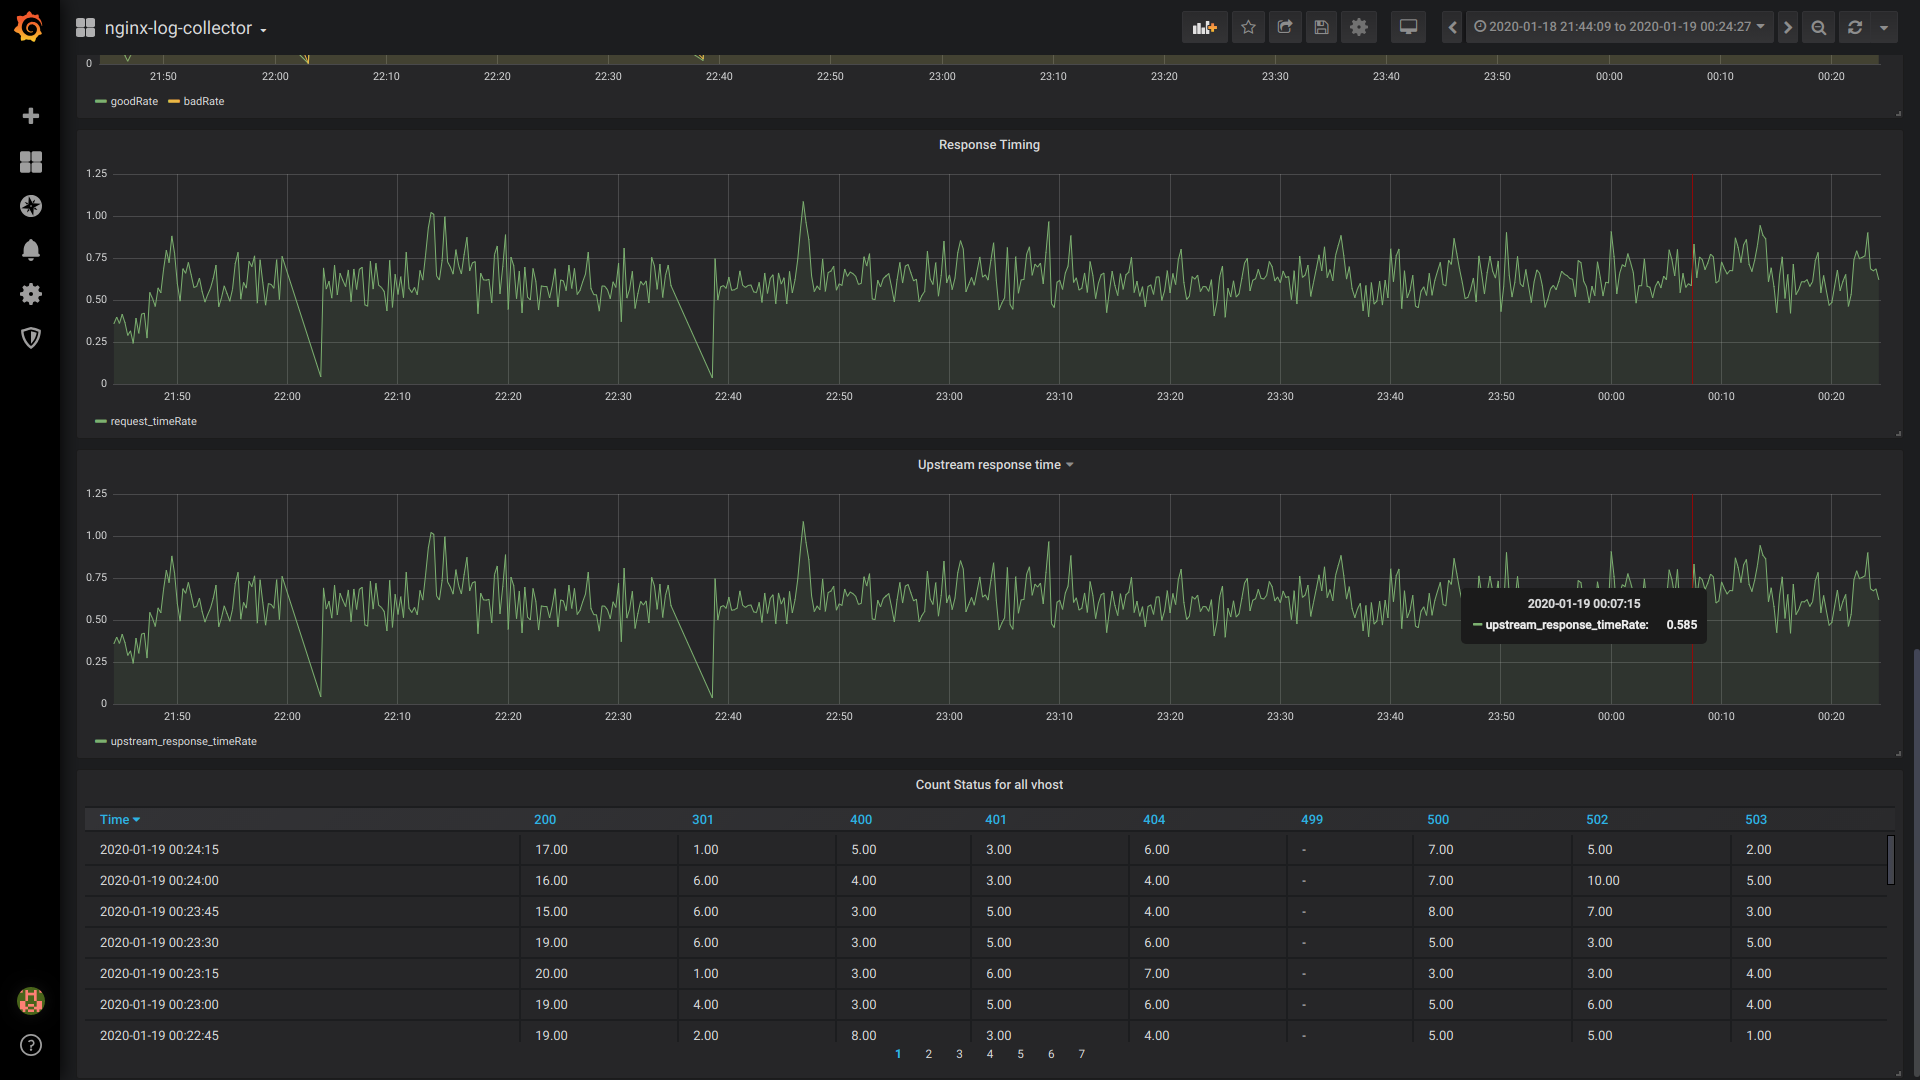
良好率/不良率:
$rate(countIf(status = 200) AS good, countIf(status != 200) AS bad) FROM $table
响应时间:
$rate(avg(request_time) as request_time) FROM $table
上游响应时间(第一个上游响应时间):
$rate(avg(arrayElement(upstream_response_time,1)) as upstream_response_time) FROM $table
所有虚拟主机的表计数状态:
$columns(status, count(*) as c) from $table
仪表板的一般视图

比较avg()和分位数()
平均()

分位数()

结论:
希望社区能够参与开发/测试和使用nginx-log-collector。
当有人实现nginx-log-collector时,有人会告诉您他节省了多少磁盘,RAM和CPU。
电报频道:
毫秒:
在本期中 ,请毫秒数对谁重要,请写信或投票。